
Overview
One of the greatest strengths of the BowTie methodology is its ability to represent risk visually. Rather than leaving hazards and controls buried in text, a BowTie draws them into a single picture that anyone in the organisation can read and act on.
What BowTie Shows
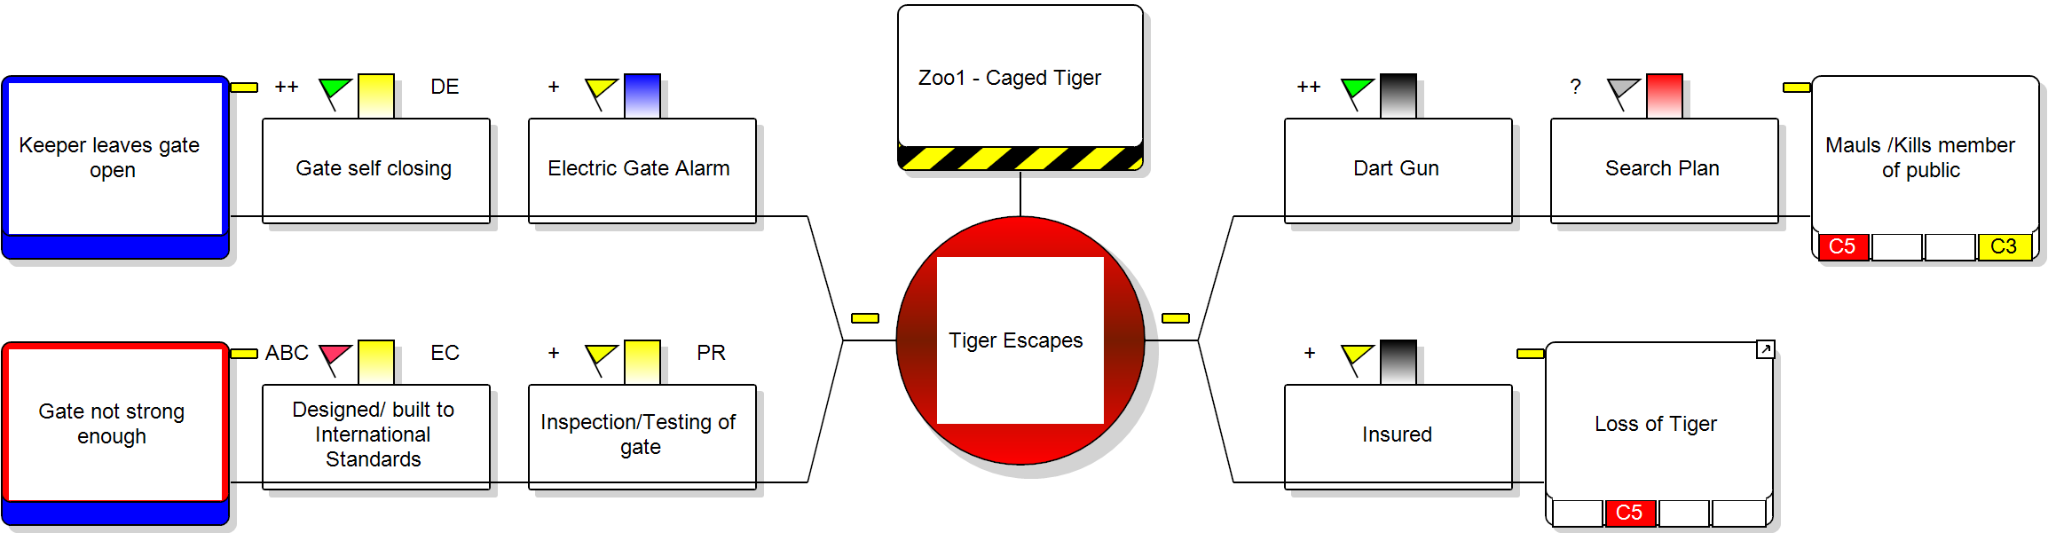
A BowTie diagram clearly illustrates:
- The hazard at the centre
- Threats on the left
- Consequences on the right
- The controls that manage the risk between them
The Core Elements of a BowTie
The diagram sets out the core elements of a BowTie, and each one has a specific role to play.
- Hazard – the central point of the diagram, representing a source of potential harm.
- Top Event – the critical moment when control over the hazard is lost, opening the door to consequences.
- Threats – the factors or conditions that could bring about the top event. These sit on the left-hand side of the diagram.
- Consequences – the potential outcomes or impacts that follow the top event. These sit on the right-hand side.
- Preventive Controls – measures put in place to stop threats from triggering the top event. They sit on the lines connecting the threats to the top event.
- Mitigative Controls – measures that lessen the consequences once the top event has occurred. They sit on the lines connecting the top event to the consequences. At this stage it is important to use a high-governance action tracker to ensure any mitigating actions are carried out promptly and effectively.
- Escalation Factors – conditions that can weaken or disable preventive and mitigative controls.
- Escalation Factor Controls – measures that manage those escalation factors and keep the primary controls working as intended.
Benefits of Visualization
A BowTie earns its keep because it turns something abstract — risk — into something people can actually see and reason about. That single shift, from words on a page to a shared picture, delivers several practical benefits.
- Grasp complex risks quickly. A risk that would take pages to describe can be taken in at a glance. The diagram shows the whole chain — from cause to control to consequence — in one view, so people understand not just what the risk is but how it is held in check.
- Communicate risks across teams. Because the format is visual and consistent, it reads the same way to an engineer, a manager, and a regulator. That common language removes the ambiguity that creeps in when different teams describe the same risk in their own words.
- Identify gaps in controls. Laying every barrier out side by side makes weaknesses obvious. A threat with only one preventive control, or a serious consequence with nothing to mitigate it, stands out immediately — and prompts action before an incident exposes the gap.
- Improve decision-making. With the full risk picture in front of them, decision-makers can direct effort and budget where it matters most: shoring up the weakest barriers, retiring controls that add little, and justifying those choices with a clear, defensible rationale.
Practical Use
The same diagram flexes to suit very different tasks, which is why organisations return to it across the whole life of a risk — before, during, and after an event.
- Risk assessments. Used proactively, a BowTie helps teams map out a hazard, test whether the current barriers are adequate, and decide where further controls are needed — all before anything goes wrong.
- Safety case development. It provides clear, structured evidence that risks have been identified and are being managed, making it a natural fit for the safety cases regulators and internal governance bodies expect to see.
- Incident analysis. Used reactively, a BowTie helps trace an event back through the barriers that failed. Seeing exactly which controls were defeated turns a single incident into a lesson that strengthens the model for next time.
- Training and workshops. Its clarity makes it an excellent teaching tool. New team members can grasp how a risk is managed far faster from a diagram than from a manual, and workshops give everyone a shared reference point to build on.
Summary
The visual structure of BowTie is what makes it such a powerful tool for raising awareness and strengthening control of risk across an organisation. By showing hazards, threats, controls, and consequences in one clear picture and by making the role of every element explicit, it helps teams see not just where the risks lie, but exactly how they are being managed.