
Overview
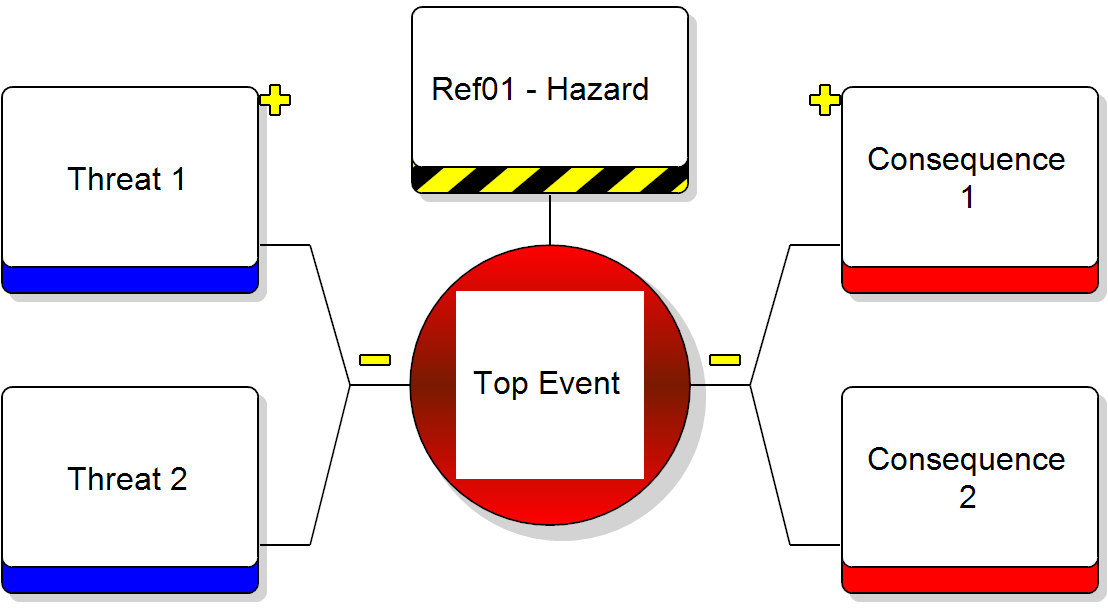
Every BowTie is assembled from the same set of building blocks. Understanding what each one means — and how it relates to the others — is the key to reading a diagram correctly and building one that stands up to scrutiny. This guide works through each element in turn, following the natural order in which you would build a BowTie: from the hazard at the centre, out to threats and consequences, and finally to the controls that hold everything in check.
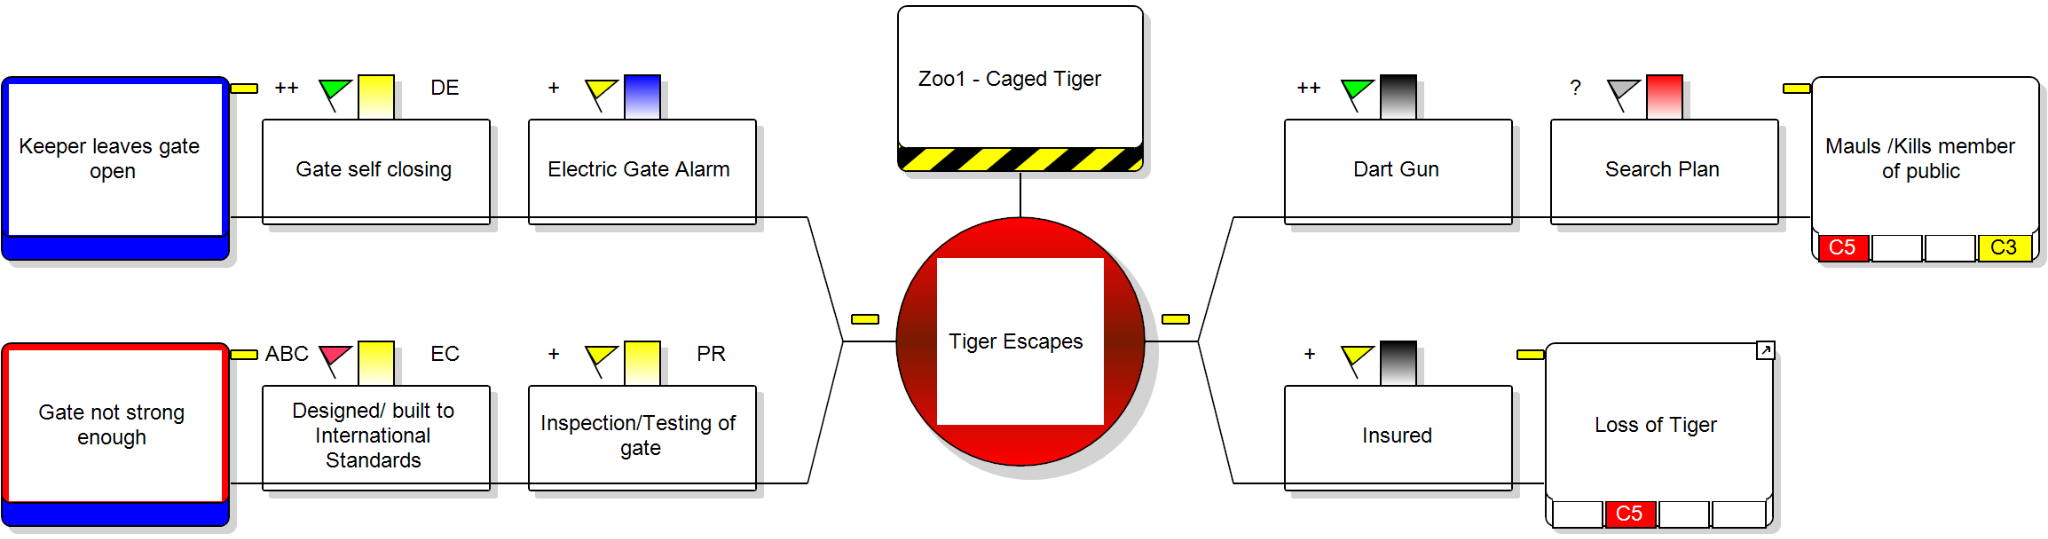
Hazard
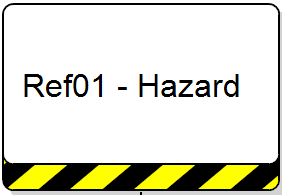
Whether you are building a BowTie or interpreting one, the hazard is the logical place to start. It describes the potential source of harm you are examining and sets the overall context and scope for everything that follows.
Take driving a car on a busy motorway. It is an everyday activity, yet one that carries a constant exposure to risk — a good example of a hazard that is simply part of normal operations and cannot realistically be eliminated.
A hazard might centre on:
- A condition – for example, icy weather
- An object – for example, another vehicle
- An activity – for example, driving itself
Because hazards are so often built into normal business, the aim is rarely to remove them altogether but to control them. It’s also worth remembering that a single hazard can give rise to several different top events.
Guiding Principles
- Define the context and scope of the BowTie clearly from the outset.
- Think about the “zoom level” — a broad hazard gives a panoramic view, a narrow one gives fine detail.
- Start broad, then refine if you need greater depth.
Traps and tips
- Trap: confusing hazards with threats, as traditional risk registers often do.
- Tip: the hazard sets the scene; threats are the direct causes of the top event.
- Trap: oversized diagrams that lose their communication value.
- Tip: if a diagram becomes unmanageable, revisit your hazard and top event definitions.
Top Event
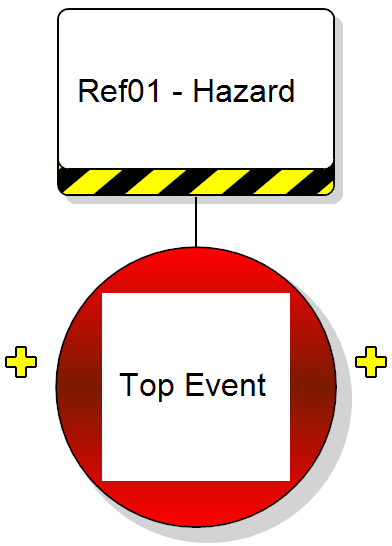
The top event marks the moment control of the hazard is lost. It describes an unsafe state — not yet an accident, but the point from which one could develop.
Sticking with the motorway example, the top event would be losing control of the car.
Guiding Principles
- Describe the loss of control clearly and precisely.
- Allow for the fact that one top event can have many causes and many possible outcomes.
- Refine the definition if the BowTie isn’t addressing the area you actually care about.
Traps and tips
- Trap: persevering with a hazard or top event definition that doesn’t fit.
- Tip: stay flexible and refine through iteration.
- Trap: trying to force several complex issues into one BowTie.
- Tip: use several smaller, manageable BowTies instead.
Threats
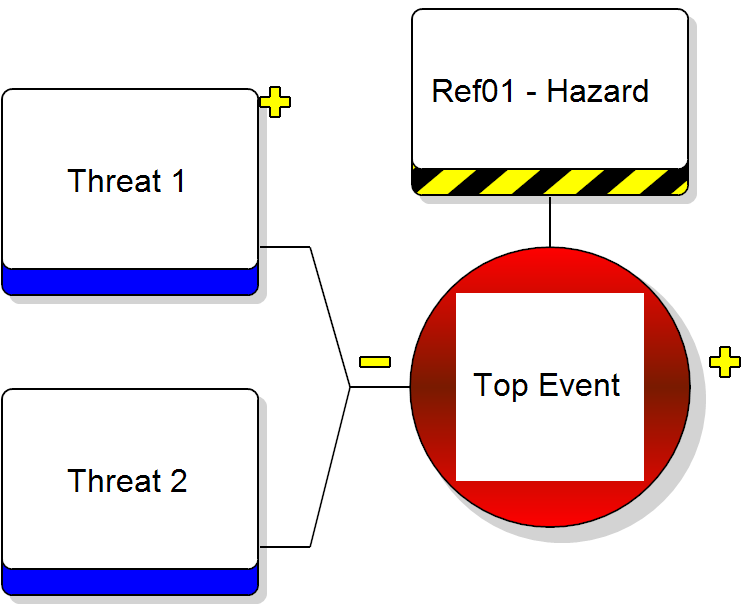
Threats sit to the left of the top event and describe the direct causes that could trigger the loss of control. Each should have a clear cause-and-effect link to the top event.
In the driving example, a tyre blow-out is a threat — a specific event that could directly cause you to lose control.
Guiding Principles
- Describe each threat as a specific, concrete event.
- Concentrate on threats that are genuinely plausible.
- Make sure each threat could cause the top event on its own.
Traps and tips
- Trap: mistaking a control failure for a threat.
- Tip: a threat causes the event; a control failure only explains why the protection didn’t hold.
Consequences
Consequences appear to the right of the top event and describe what may happen if the recovery controls fail. Importantly, a consequence is an event — not the loss or impact itself.
Continuing the example, a collision resulting in serious injury or a fatality would be a consequence.
Guiding Principles
- Write consequences in practical, operational terms.
- Keep the distinction clear between a consequence (the event) and an outcome (the impact it has).
- Ensure every consequence follows logically from the top event.
Prevention Controls
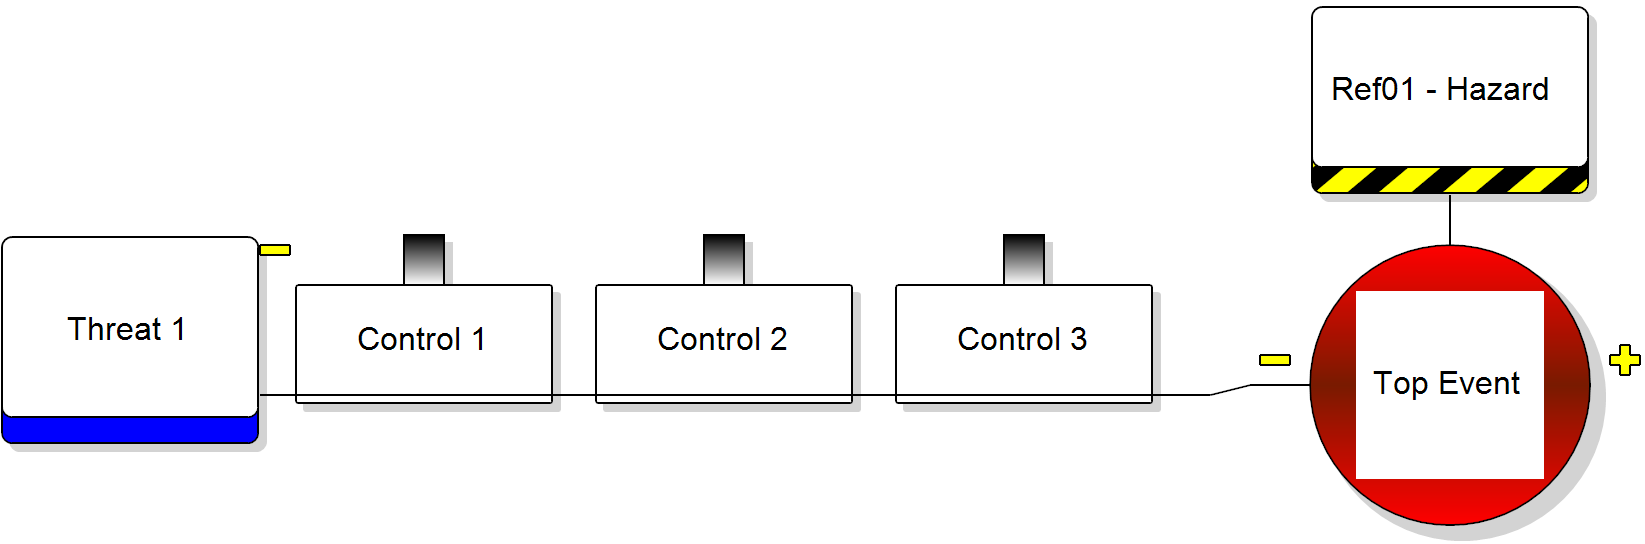
Prevention controls sit on the left-hand side of the diagram and work to stop threats from ever reaching the top event. They do this either by removing the threat or by stopping it from escalating.
Traps and tips
- Trap: vague labels such as “Maintenance.”
- Tip: state exactly what action is taken and how it breaks the chain of events.
- Trap: too little detail — or too much.
- Tip: aim for a concise, clear, one-sentence description.
Recovery Controls
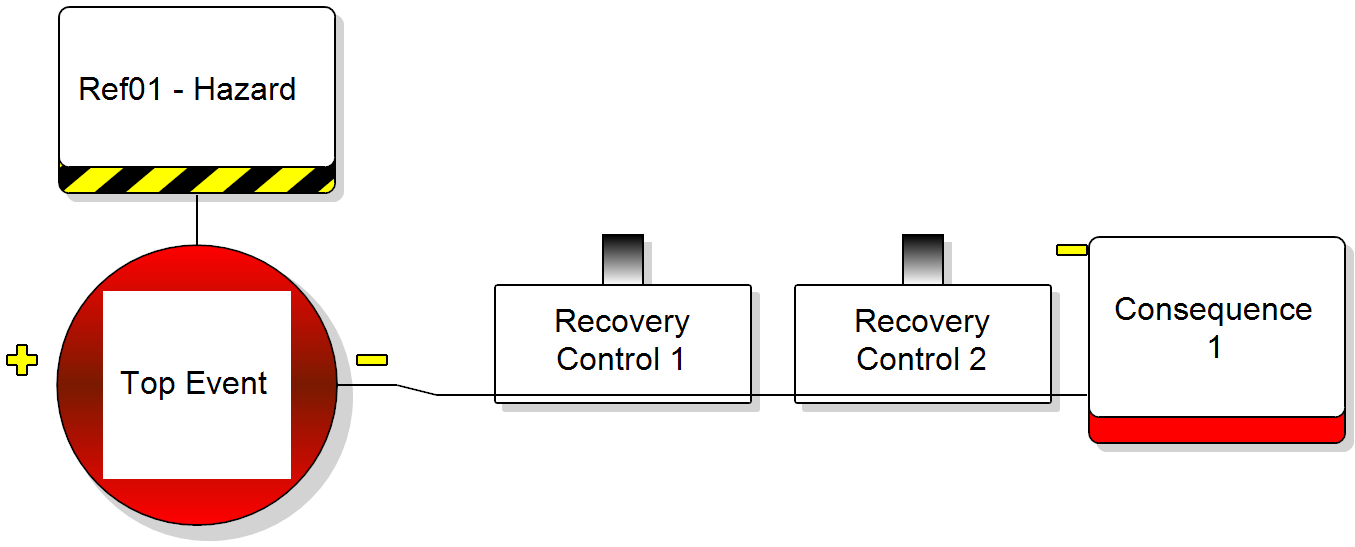
Recovery controls sit on the right-hand side of the top event. Once the top event has occurred, they work to reduce the likelihood of a consequence or to soften its severity.
Familiar examples from the road include anti-lock braking systems (ABS) and airbags.
Controls can act one after another or side by side. For clarity, BowTie diagrams usually show them in sequence — but in the real world you should always account for how controls depend on one another.
Escalation Factors
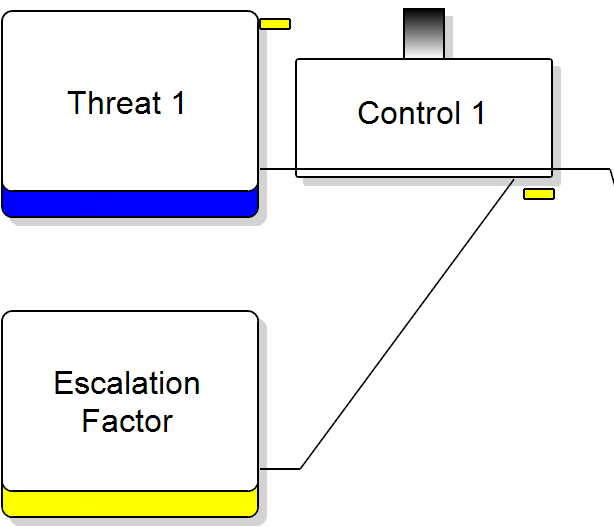
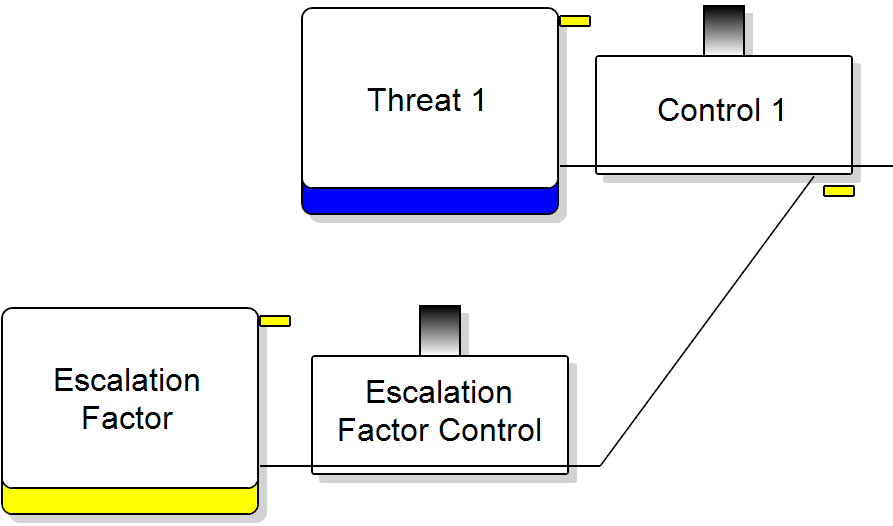
Escalation factors explain how a control might weaken or fail. They don’t cause the top event directly, but they make its progression more likely by undermining the barriers you’re relying on.
Traps and tips
- Trap: generic statements such as “radio does not work.”
- Tip: describe clearly why or how the control is degraded.
- Trap: so many escalation factors that the diagram becomes cluttered.
- Tip: include only the credible, significant ones.
Escalation Factor Controls
Escalation factor controls manage the very conditions that weaken your other controls. Their job is to keep your prevention and recovery barriers dependable when it matters most.
Guiding Principles
- Focus each one specifically on managing its escalation factor.
- Build diagrams to a single level of escalation factor to keep them readable.
Summary
Hazards, top events, threats, and consequences form the backbone of every BowTie, while prevention controls, recovery controls, and escalation factor controls determine how well the risk is actually managed. Getting the definitions right — and keeping each element in its proper place — is what turns a BowTie from a tidy drawing into a genuinely useful risk assessment.