Overview
The Hazard Overview screen is the main workspace for viewing and managing an individual hazard in BowTiePro. It provides access to the BowTie structure, associated threats and consequences, diagrams, reporting tools, and related actions.
Opening the Hazard Overview Screen
1. Go to Hazards
- From the top menu, click Hazards
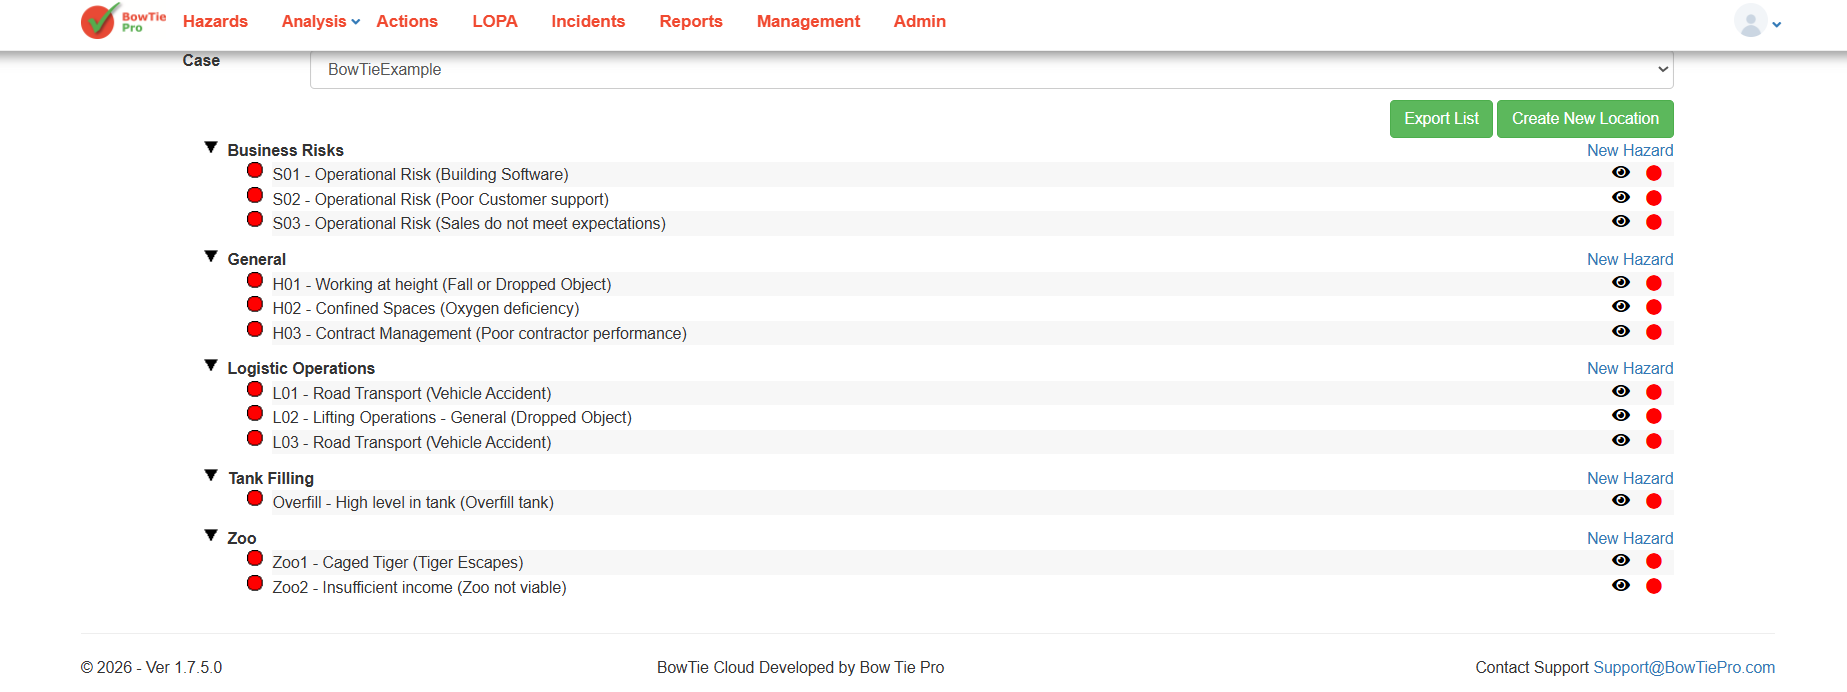
2. Open a Hazard
- Locate the required hazard in the list
- Click the 👁 (View) icon next to the hazard
👉 This opens the Hazard Overview screen
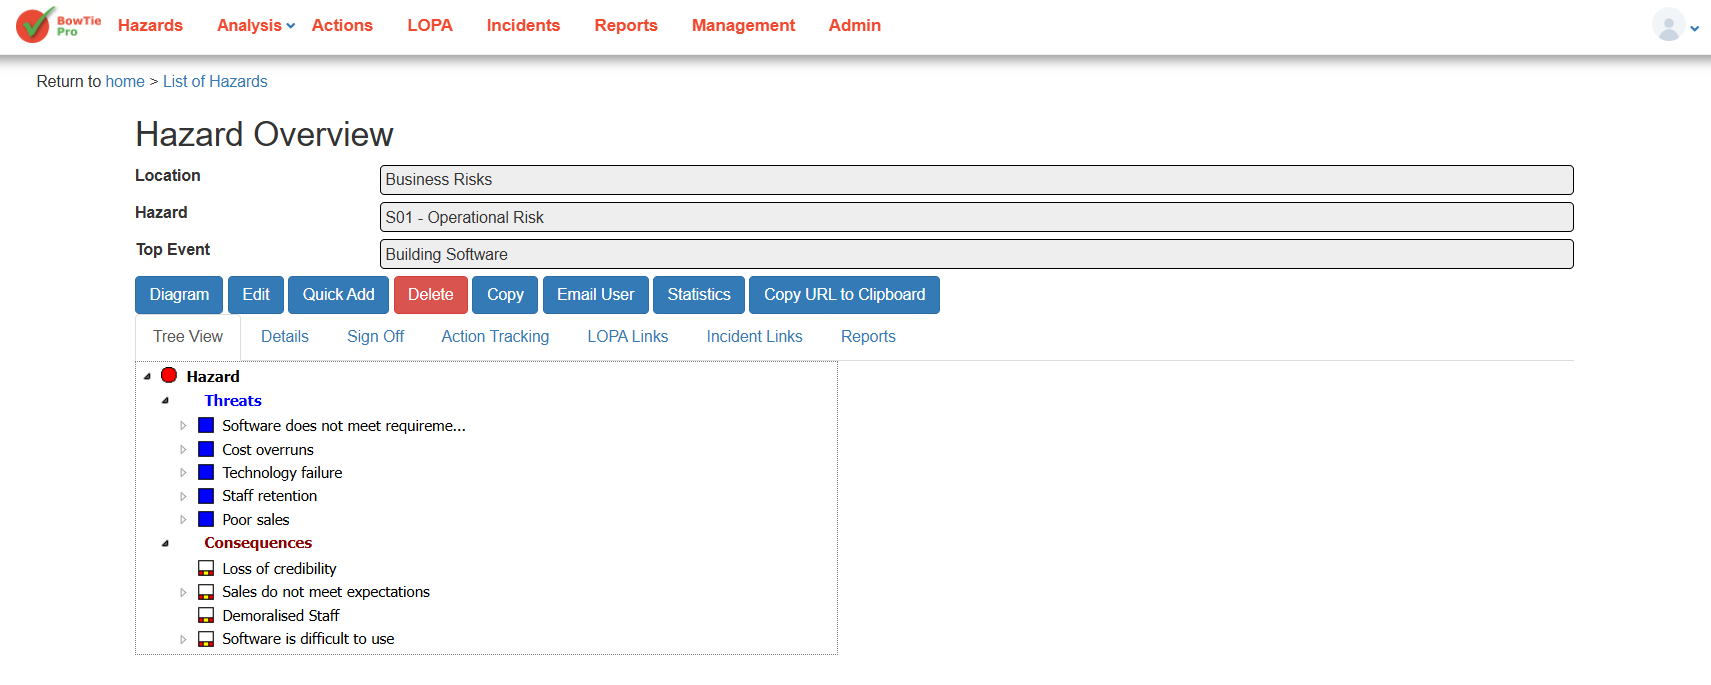
Hazard Information Section
At the top of the screen, the following information is displayed:
- Location
- Hazard
- Top Event
These fields provide a summary of the selected BowTie item.
Action Buttons
The Hazard Overview screen includes several action buttons.
Diagram
Opens the BowTie diagram view for the selected hazard.
Edit
Allows you to modify the hazard details.
Quick Add
Used to quickly add:
- Threats
- Consequences
- Controls
Delete
Removes the hazard from the system.
Copy
Creates a duplicate of the hazard.
Email User
Allows hazard information to be shared via email.
Statistics
Displays statistical information related to the hazard.
Copy URL to Clipboard
Copies a direct link to the hazard overview screen.
Navigation Tabs
The screen also contains multiple navigation tabs.
Tree View
Displays the BowTie structure including:
- Threats
- Consequences
- Related hierarchy
Details
Shows additional information related to the hazard.
Sign Off
Used for review or approval workflows.
Action Tracking
Displays linked actions and follow-up activities.
LOPA Links
Shows associated LOPA assessments and links.
Incident Links
Displays related incidents connected to the hazard.
Reports
Provides reporting options for the selected hazard.
Tree View Structure
Within the Tree View:
Threats
Threats represent causes that may lead to the top event.
Examples:
- Cost overruns
- Technology failure
- Staff retention
Consequences
Consequences represent outcomes that may occur if the top event happens.
Examples:
- Loss of credibility
- Sales do not meet expectations
- Demoralised staff
The Hazard Overview screen acts as the central management area for BowTie analysis in BowTiePro. It provides access to the complete hazard structure, controls, actions, diagrams, and reporting tools needed for effective risk management.
Overview
The BowTie Diagram View provides a visual representation of the selected hazard and its associated risk structure. It helps users understand how threats can lead to a top event and how controls are used to prevent or mitigate risk.
The diagram view is one of the core features of BowTiePro and is designed to improve risk visualization and analysis.
Opening the Diagram View
1. Go to the Hazards Section
- From the top menu, click Hazards
2. Open a Hazard
- Click the 👁 (View) icon next to a hazard
This opens the Hazard Overview screen.
3. Click “Diagram”
- On the Hazard Overview screen, click the Diagram button
👉 This opens the BowTie Diagram View.
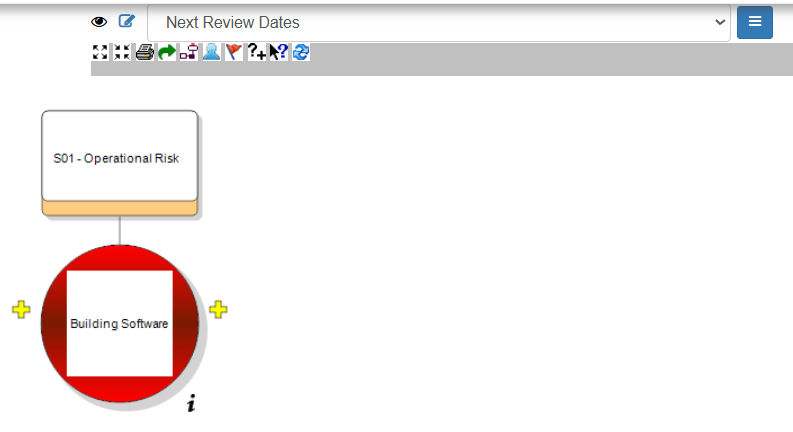
Understanding the Diagram Layout
The diagram screen visually represents the hazard structure.
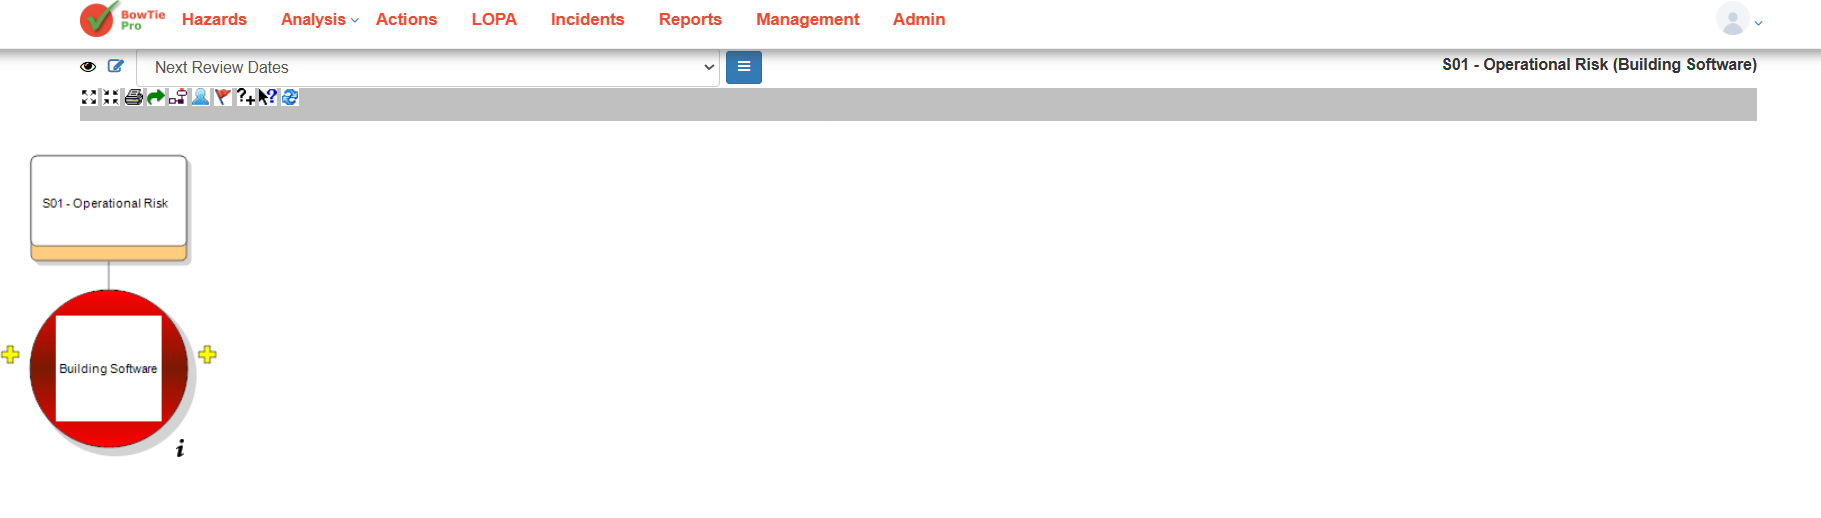
Hazard
The hazard is displayed at the top of the diagram.
Example:
- S01 – Operational Risk
Top Event
The top event appears in the main diagram area.
Example:
- Building Software
The top event represents the point where control over the hazard is lost.
Threats and Consequences
Threats and consequences are connected around the top event to form the BowTie structure.
- Threats appear on the left side
- Consequences appear on the right side
Controls
Controls are positioned between:
- Threats and the top event
- Top event and consequences
These controls act as barriers to reduce risk.
Diagram Toolbar
The toolbar at the top of the diagram includes multiple options for managing and interacting with the BowTie view.
Depending on permissions and configuration, toolbar options may include:
- Zoom controls
- Layout options
- Display settings
- Edit functions
- Navigation tools
Diagram Display Options
At the top of the screen, you can also select:
- Different diagram views/layouts
- Saved display configurations
Example:
- Default view
Navigating the Diagram
You can interact with the diagram by:
- Selecting diagram elements
- Expanding or viewing linked items
- Using toolbar controls to adjust the layout
Best Practices
- Use the diagram view during risk reviews and workshops
- Keep threat and consequence structures organized
- Ensure controls are properly linked
- Regularly review diagram accuracy
Summary
The BowTie Diagram View provides a clear visual representation of hazards, threats, consequences, and controls. It helps users better understand risk pathways and supports more effective risk management within BowTiePro.
Overview
The Diagram Toolbar in BowTiePro provides quick access to tools used for navigating, viewing, and interacting with the BowTie diagram. These tools help users manage the diagram layout, adjust visibility settings, and improve the overall viewing experience.
The toolbar is located at the top of the Diagram View screen.
Accessing the Diagram Toolbar
1. Open a Hazard
- Go to Hazards
- Click the 👁 (View) icon next to a hazard
2. Open Diagram View
- On the Hazard Overview screen, click Diagram
👉 The toolbar will appear above the diagram workspace.
Toolbar Functions
Depending on permissions and system configuration, the toolbar may include the following functions.
Zoom Controls
Zoom tools allow you to:
- Zoom in
- Zoom out
- Fit the diagram to screen
These options help improve visibility when working with large BowTie diagrams.
Diagram Navigation
Navigation tools help users:
- Move around the workspace
- Reposition the diagram
- Focus on specific areas
Expand and Collapse Functions
These tools allow users to:
- Expand sections of the BowTie
- Collapse items to simplify the view
This is useful for complex risk models.
Layout and Display Tools
Display tools help control:
- Diagram appearance
- Visibility of items
- Arrangement of diagram components
Refresh or Reload Functions
Some toolbar functions may refresh or reload the diagram after updates are made.
Edit and Interaction Tools
Depending on user permissions, toolbar functions may also support:
- Editing diagram elements
- Adding linked items
- Managing relationships
Diagram View Selector
The toolbar area also allows users to:
- Select saved diagram layouts
- Switch between display configurations
Example:
- Default view
Best Practices
- Use zoom tools for large diagrams
- Collapse unnecessary sections to improve readability
- Regularly refresh diagrams after updates
- Use saved display layouts for consistency
Summary
The Diagram Toolbar provides essential controls for interacting with BowTie diagrams in BowTiePro. These tools help users navigate, organize, and manage complex risk visualizations more effectively.
Overview
BowTiePro allows users to export or print BowTie diagrams for reporting, presentations, reviews, and documentation purposes.
The export and print functions are available directly within the Diagram View toolbar.
Accessing Diagram View
Step 1: Open the Hazards Section
From the top navigation menu:
- Click Hazards
This opens the Hazard List screen.
Step 2: Open a Hazard
Locate the required hazard and click the 👁 (View) icon.
This opens the Hazard Overview screen.
Step 3: Open Diagram View
On the Hazard Overview screen:
- Click Diagram
The BowTie Diagram View screen will open.
Exporting the Diagram
Step 1: Review the Diagram Layout
Before exporting:
- Adjust the diagram view if required
- Expand or collapse sections
- Select the preferred diagram display option
- Ensure all required information is visible
This helps ensure the exported image is clear and readable.
Step 2: Locate the Export Toolbar
At the top of the Diagram View screen, locate the toolbar section. The toolbar contains several diagram tools, including the PNG export option.
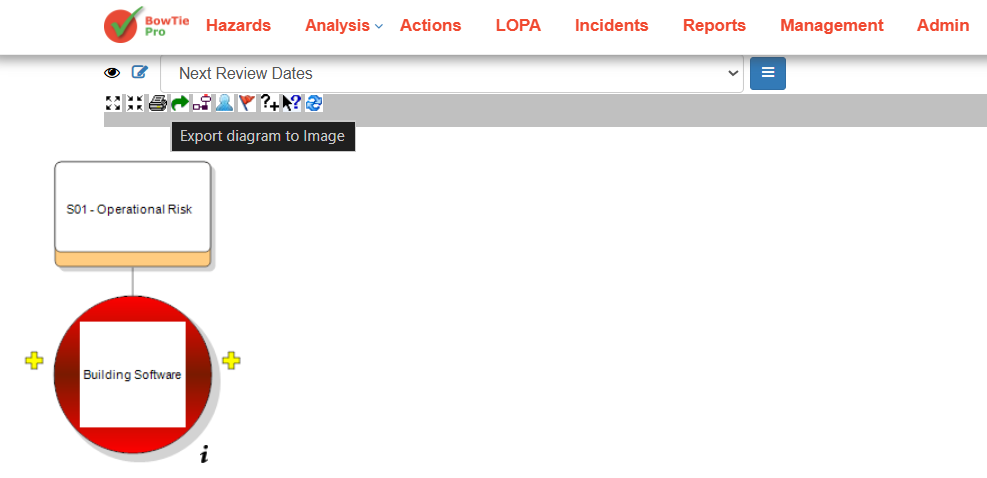
Step 3: Export as PNG
Click the PNG export icon in the toolbar.
BowTiePro will generate and download the current diagram as a PNG image file.
The exported image can then be:
- Shared with stakeholders
- Added to reports
- Used in presentations
- Stored for future reference
Overview
BowTie Pro allows users to customize how BowTie diagrams are displayed. These settings help improve readability, adjust diagram appearance, and control what information is shown within the diagram view.
Diagram display settings can be configured for hazards, threats, consequences, controls, fonts, colours, and other visual elements.
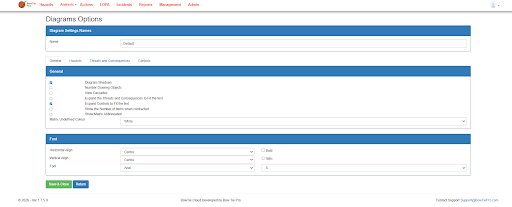
Accessing Diagram Display Options
To open the Diagram Options screen:
- Open the required hazard.
- Open the BowTie Diagram view.
- Click the Diagram Options icon from the diagram toolbar.
The Diagram Options screen will open.
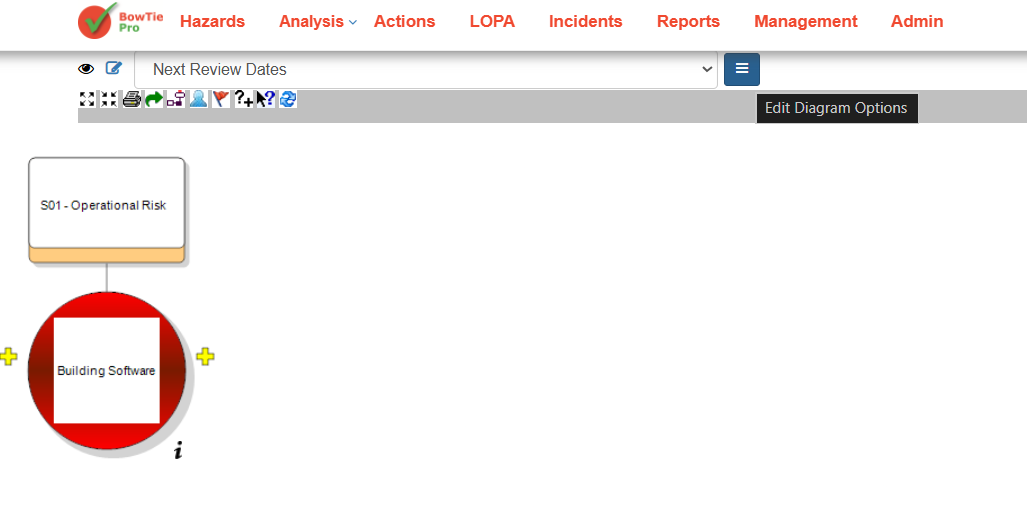
Diagram Settings Name
At the top of the page, users can define a name for the diagram configuration.
Example:
- Default
- Next Review Dates
This allows multiple diagram display configurations to be created and reused.
General Display Options
The General tab contains options that control overall diagram behavior and visibility.
Available settings may include:
- Diagram Shadows
- Number Drawing Objects
- View Cascades
- Expand Threats and Consequences to Fit Text
- Expand Controls to Fit Text
- Show Number of Items When Contracted
- Show Matrix Abbreviation
- Matrix Undefined Colour
These settings help users control how information is presented within the diagram.
Font Settings
The Font section allows users to customize text appearance within diagrams.
Available options include:
- Horizontal Alignment
- Vertical Alignment
- Font Type
- Font Size
- Bold
- Italic
These settings improve readability and support different diagram presentation styles.
Hazards Tab
The Hazards tab contains display settings related to hazard appearance within the diagram.
Users can configure how hazards are displayed visually.
Threats and Consequences Tab
The Threats and Consequences tab controls the appearance and visibility of:
- Threat nodes
- Consequence nodes
- Labels
- Colours
- Display behaviors
This helps users tailor diagram layouts based on reporting or operational needs.
Controls Tab
The Controls tab allows users to customize how prevention and recovery controls appear within the BowTie diagram.
Users may configure:
- Control display styles
- Colours
- Text visibility
- Layout preferences
Saving Diagram Options
After making the required changes:
- Review the updated settings.
- Click Save or Save & Close.
- Reopen the diagram to view the updated display configuration if required.
BowTiePro allows users to update and manage action information throughout the action lifecycle.
Editing action details helps organizations:
- Maintain accurate records
- Update responsibilities
- Adjust priorities
- Revise target dates
- Track workflow progress
- Improve operational follow-up
Users can edit actions directly from the Action List or Action Board views.
Opening an Action
To edit an existing action:
- Log in to BowTiePro.
- Navigate to the Actions module.
- Open either:
- Action List view
- Action Board view
- Select the required action.
The Action Details screen will open.
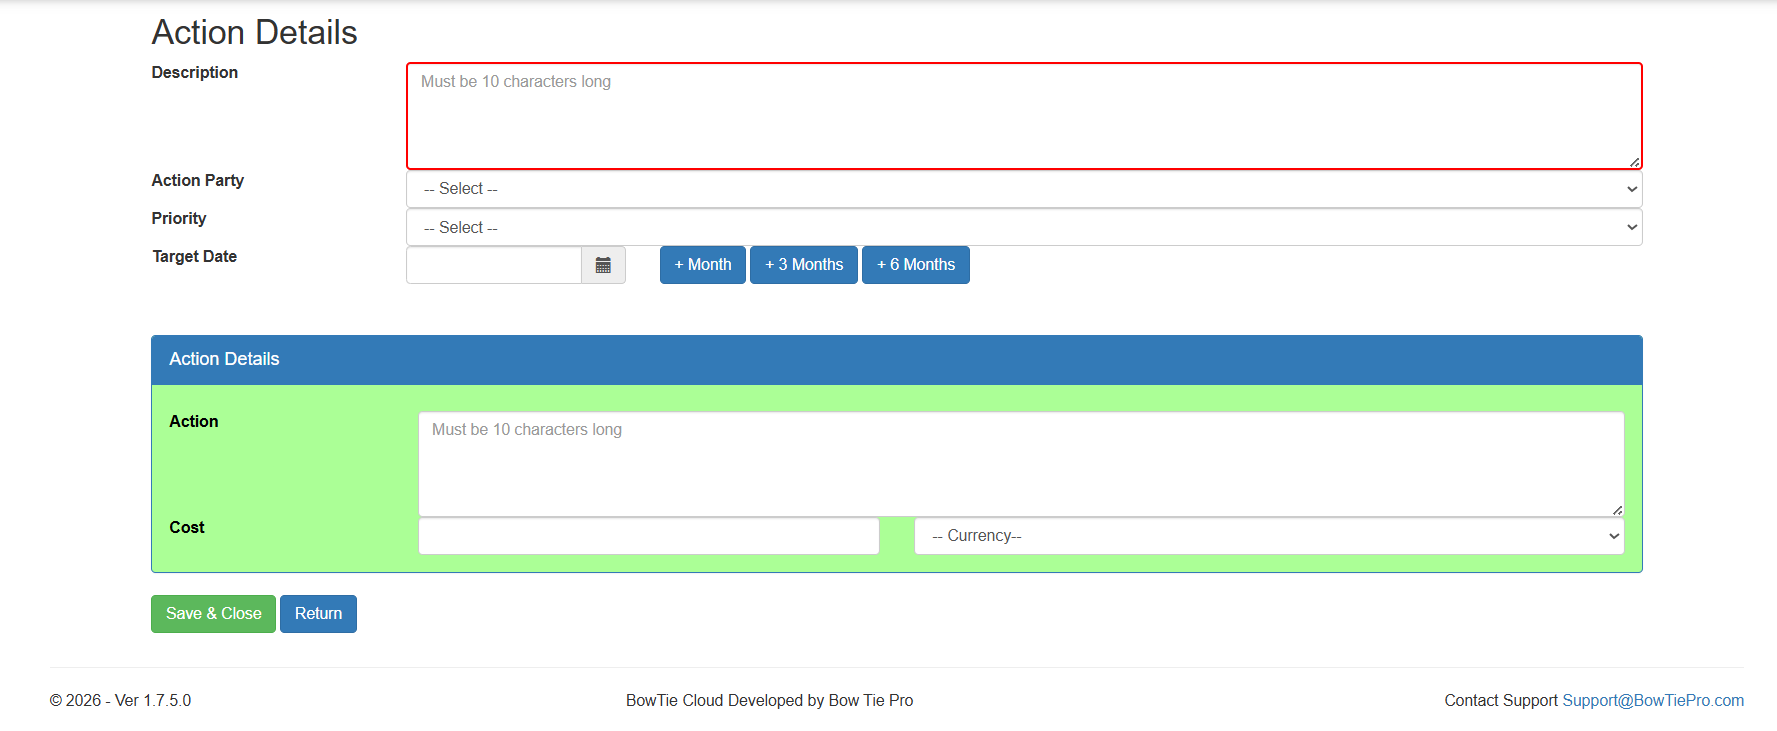
Understanding the Action Details Screen
The Action Details screen contains all information related to the selected action.
Typical fields include:
- Description
- Action Party
- Priority
- Target Date
- Action Details
- Cost information
- Workflow information
This screen is used to manage and update the action throughout its lifecycle.
Editing the Action Description
The Description field can be updated to provide more accurate or detailed information about the required activity.
Descriptions should:
- Clearly explain the task
- Be specific and actionable
- Reflect the latest operational requirements
Updating the Assigned Party
The Action Party field allows users to reassign ownership of the action when required.
This may be necessary if:
- Responsibilities change
- Teams are restructured
- Additional expertise is needed
Keeping ownership updated helps maintain accountability.
Changing Priority Levels
The Priority field can be modified to reflect changing operational risk levels or business requirements.
Priority updates help organizations:
- Focus on critical actions
- Improve workload management
- Address urgent deficiencies more quickly
Updating the Target Date
Users can revise the Target Date when timelines change.
Target dates should remain:
- Realistic
- Achievable
- Aligned with operational priorities
Updated dates help improve tracking and reporting accuracy.
Editing Action Details and Notes
The Action Details section allows users to:
- Add implementation notes
- Update progress information
- Record operational comments
- Provide additional instructions
Maintaining detailed notes improves communication and audit traceability.
Saving Changes
After updating the required fields:
- Review all changes carefully.
- Click Save or Save & Close.
The updated information will immediately appear within:
- Action List view
- Action Board view
- Workflow tracking screens
Benefits of Keeping Action Details Updated
Maintaining accurate action information helps organizations:
- Improve accountability
- Track operational progress
- Reduce overdue actions
- Improve audit readiness
- Strengthen workflow visibility
- Support better operational decision-making
Best Practices
When editing action details:
- Keep descriptions clear and current
- Update ownership promptly
- Review priorities regularly
- Maintain accurate due dates
- Add meaningful progress notes
- Save changes consistently
The BowTie methodology is a barrier-based risk management approach used to identify, assess, and control risks in a clear and structured way. It provides a visual representation of how risks occur and how they can be prevented or mitigated.
This method is widely used across industries to improve safety, communicate risk, and support decision-making.
What is a BowTie Model?
A BowTie model visually connects:
- A hazard (source of risk)
- A top event (loss of control)
- The causes (threats) leading to the event
- The consequences if the event occurs
- The controls (barriers) that prevent or reduce risk
This structure allows organizations to clearly understand how risks develop and how they are managed.
Why Use BowTie?
The BowTie methodology helps organizations:
- Clearly visualize risk scenarios
- Identify critical safety controls
- Improve communication across teams
- Support regulatory and compliance requirements
- Strengthen risk management processes
Where is BowTie Used?
BowTie is commonly used in industries such as:
- Oil & Gas
- Aviation
- Healthcare
- Construction
- Mining
- Energy and Utilities
It is especially useful in environments where risks are complex and high-impact.
Summary
The BowTie methodology provides a simple yet powerful way to understand and manage risk, combining visual clarity with structured analysis to support safer operations.
Overview
A BowTie model is built around several core elements that define how risks are structured and managed.
Hazard
A hazard is anything with the potential to cause harm.
Examples include:
- Activities (e.g., driving)
- Conditions (e.g., icy roads)
- Objects (e.g., machinery)
Hazards are often part of normal operations and cannot always be eliminated.
Top Event
The top event represents the moment when control over the hazard is lost. It is not the final outcome but the point where the system becomes unsafe.
Example:
- Losing control of a vehicle
Threats
Threats are the direct causes that can lead to the top event. They must have a clear cause-and-effect relationship.
Example:
- Tyre blow-out
Consequences
Consequences are the outcomes that may occur if the top event is not controlled.
Example:
- Collision resulting in injury
Summary
These elements form the backbone of the BowTie model, helping organizations clearly map how risks originate and develop.
Overview
Controls (or barriers) are measures used to manage risk within a BowTie model.
They are divided into two types:
Prevention Controls
Prevention controls are placed on the left side of the BowTie.
They are designed to:
- Stop threats from causing the top event
- Eliminate or reduce the likelihood of risk
Example:
- Maintenance procedures
- Safety checks
Recovery Controls
Recovery controls are placed on the right side of the BowTie.
They are designed to:
- Reduce the impact after the top event occurs
- Limit the severity of consequences
Example:
- Emergency response systems
- Safety equipment
Key Difference
| Prevention Controls | Recovery Controls |
| Stop the event | Reduce impact |
| Before top event | After top event |
Summary
Together, prevention and recovery controls provide a complete risk management strategy, addressing both causes and outcomes.
What are Escalation Factors?
Escalation factors are conditions that can weaken or cause failure of controls. They do not directly cause the top event but increase the likelihood of it occurring.
Example
- A safety system exists (control)
- Poor maintenance reduces its effectiveness (escalation factor)
Why They Matter
Escalation factors help identify:
- Weak points in safety systems
- Conditions that increase risk
- Areas requiring additional controls
Escalation Factor Controls
Additional controls can be introduced to manage escalation factors and ensure primary controls remain effective.
Summary
Understanding escalation factors helps organizations ensure that their controls remain reliable and effective over time.