Overview
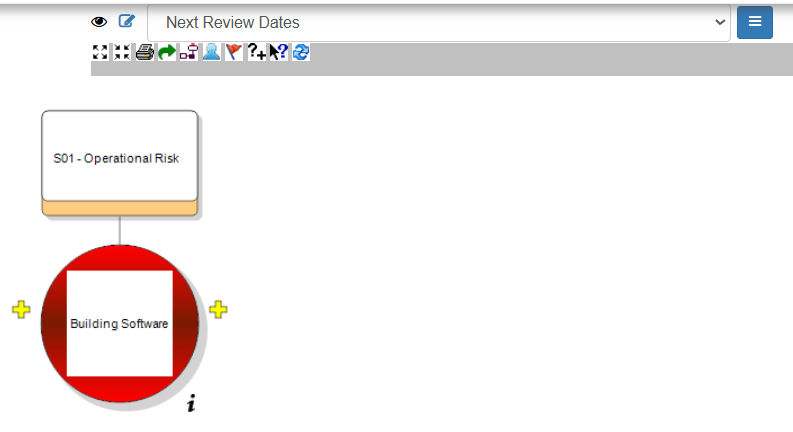
The Diagram Toolbar in BowTiePro provides quick access to tools used for navigating, viewing, and interacting with the BowTie diagram. These tools help users manage the diagram layout, adjust visibility settings, and improve the overall viewing experience.
The toolbar is located at the top of the Diagram View screen.
Accessing the Diagram Toolbar
1. Open a Hazard
- Go to Hazards
- Click the 👁 (View) icon next to a hazard
2. Open Diagram View
- On the Hazard Overview screen, click Diagram
👉 The toolbar will appear above the diagram workspace.
Toolbar Functions
Depending on permissions and system configuration, the toolbar may include the following functions.
Zoom Controls
Zoom tools allow you to:
- Zoom in
- Zoom out
- Fit the diagram to screen
These options help improve visibility when working with large BowTie diagrams.
Diagram Navigation
Navigation tools help users:
- Move around the workspace
- Reposition the diagram
- Focus on specific areas
Expand and Collapse Functions
These tools allow users to:
- Expand sections of the BowTie
- Collapse items to simplify the view
This is useful for complex risk models.
Layout and Display Tools
Display tools help control:
- Diagram appearance
- Visibility of items
- Arrangement of diagram components
Refresh or Reload Functions
Some toolbar functions may refresh or reload the diagram after updates are made.
Edit and Interaction Tools
Depending on user permissions, toolbar functions may also support:
- Editing diagram elements
- Adding linked items
- Managing relationships
Diagram View Selector
The toolbar area also allows users to:
- Select saved diagram layouts
- Switch between display configurations
Example:
- Default view
Best Practices
- Use zoom tools for large diagrams
- Collapse unnecessary sections to improve readability
- Regularly refresh diagrams after updates
- Use saved display layouts for consistency
Summary
The Diagram Toolbar provides essential controls for interacting with BowTie diagrams in BowTiePro. These tools help users navigate, organize, and manage complex risk visualizations more effectively.