Overview
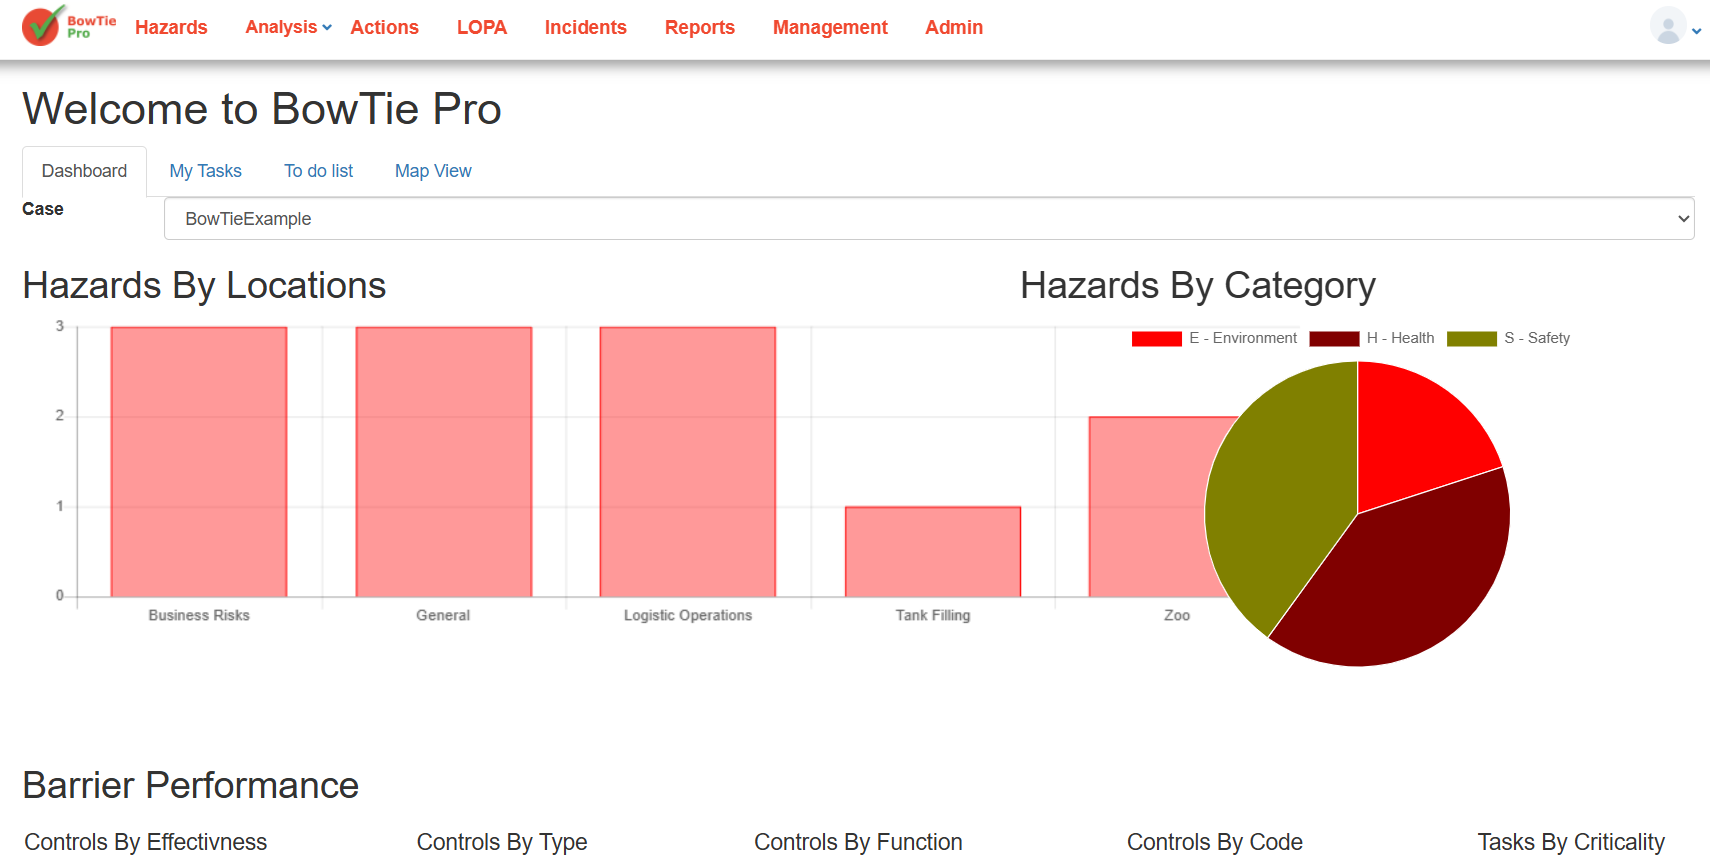
The BowTie Diagram View provides a visual representation of the selected hazard and its associated risk structure. It helps users understand how threats can lead to a top event and how controls are used to prevent or mitigate risk.
The diagram view is one of the core features of BowTiePro and is designed to improve risk visualization and analysis.
Opening the Diagram View
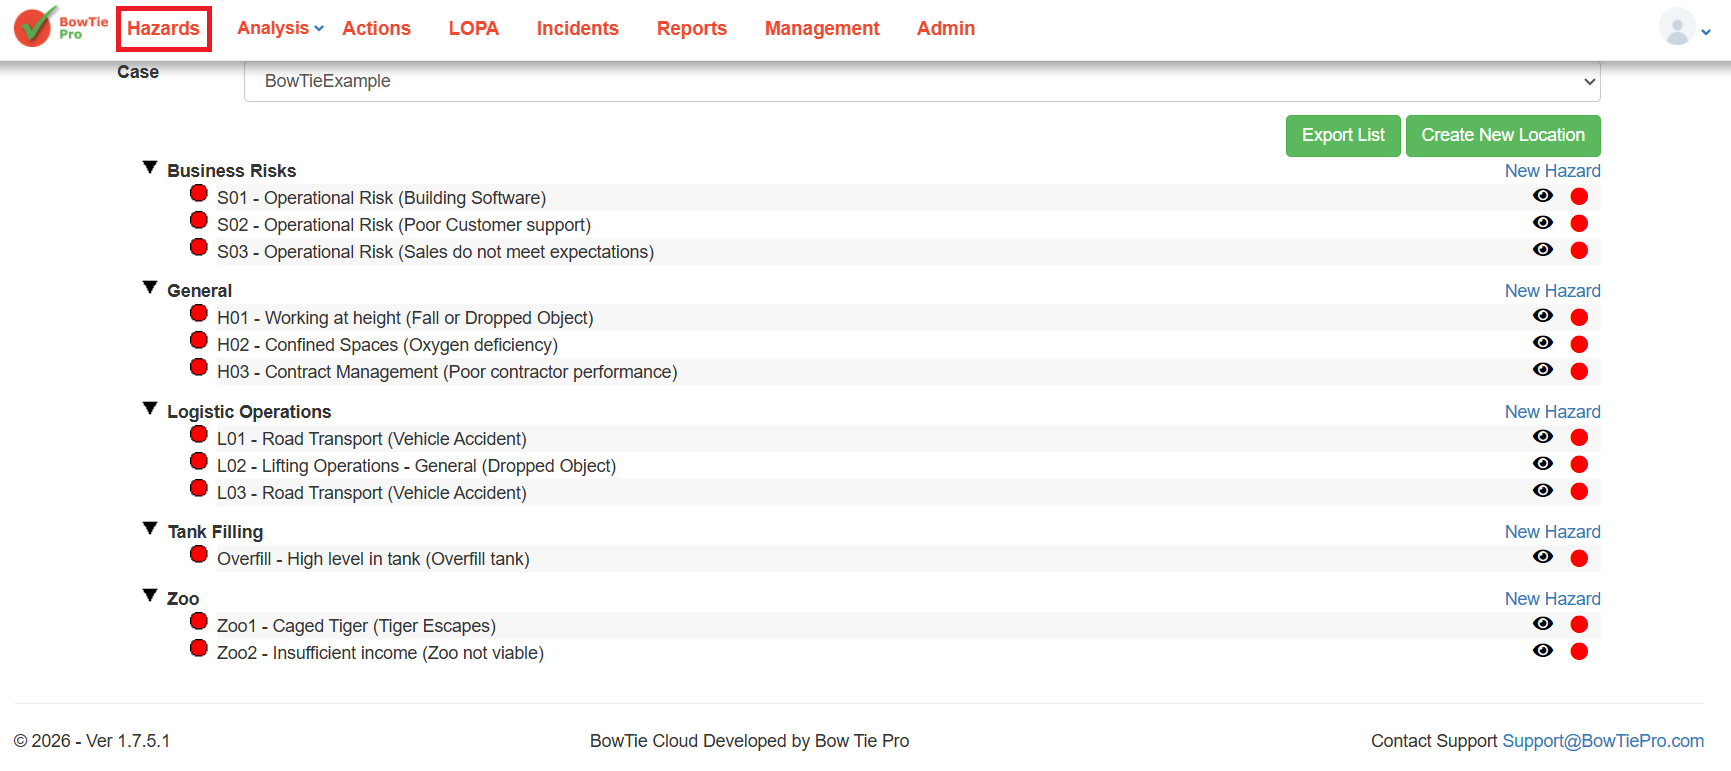
1. Go to the Hazards Section
- From the top menu, click Hazards
2. Open a Hazard
- Click the 👁 (View) icon next to a hazard
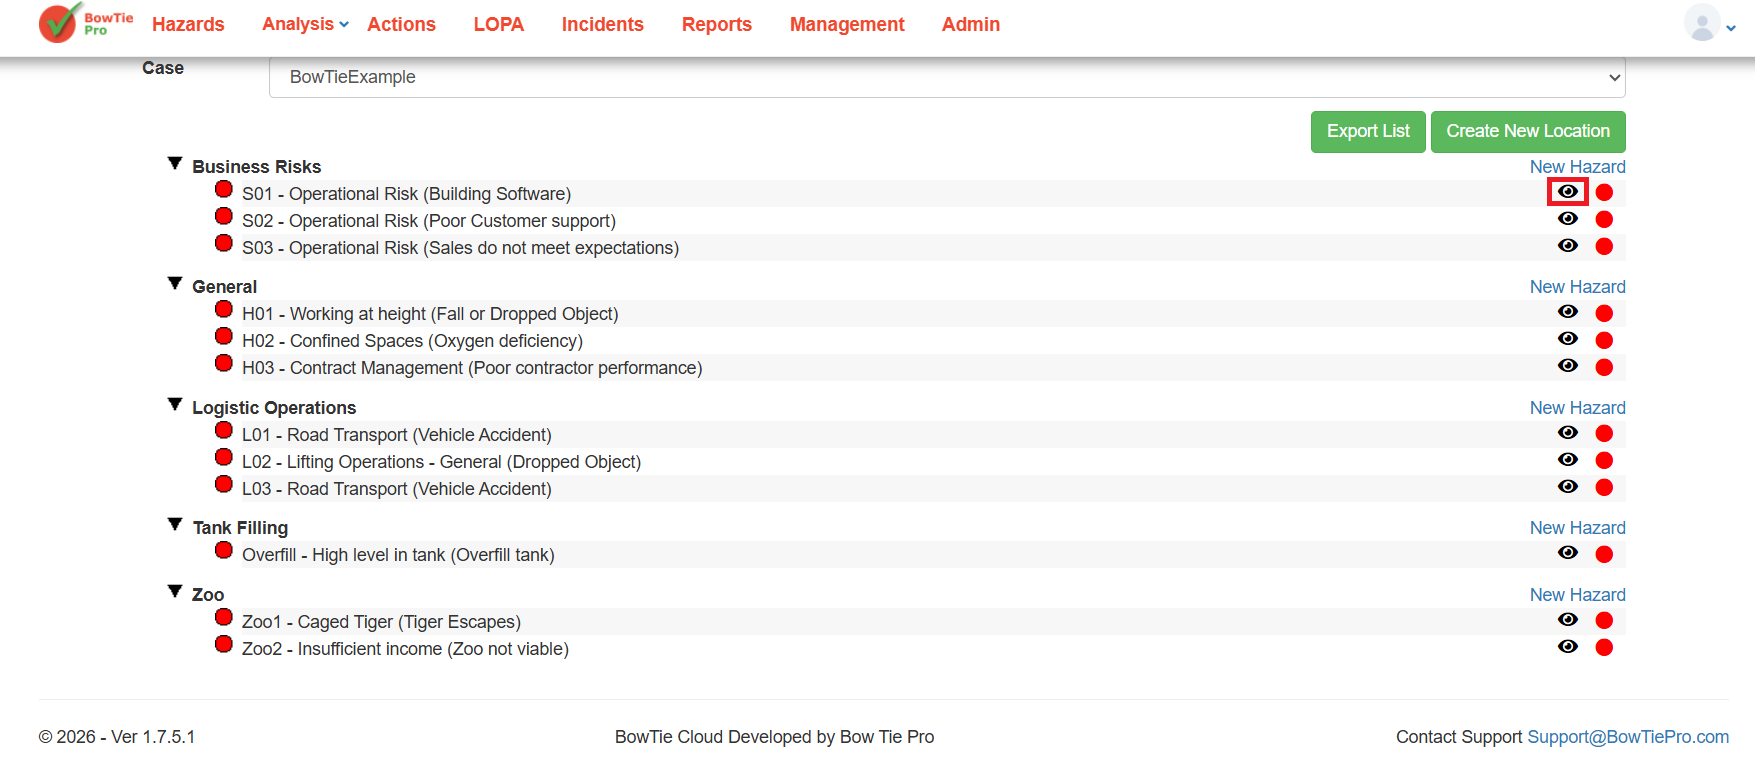
This opens the Hazard Overview screen.
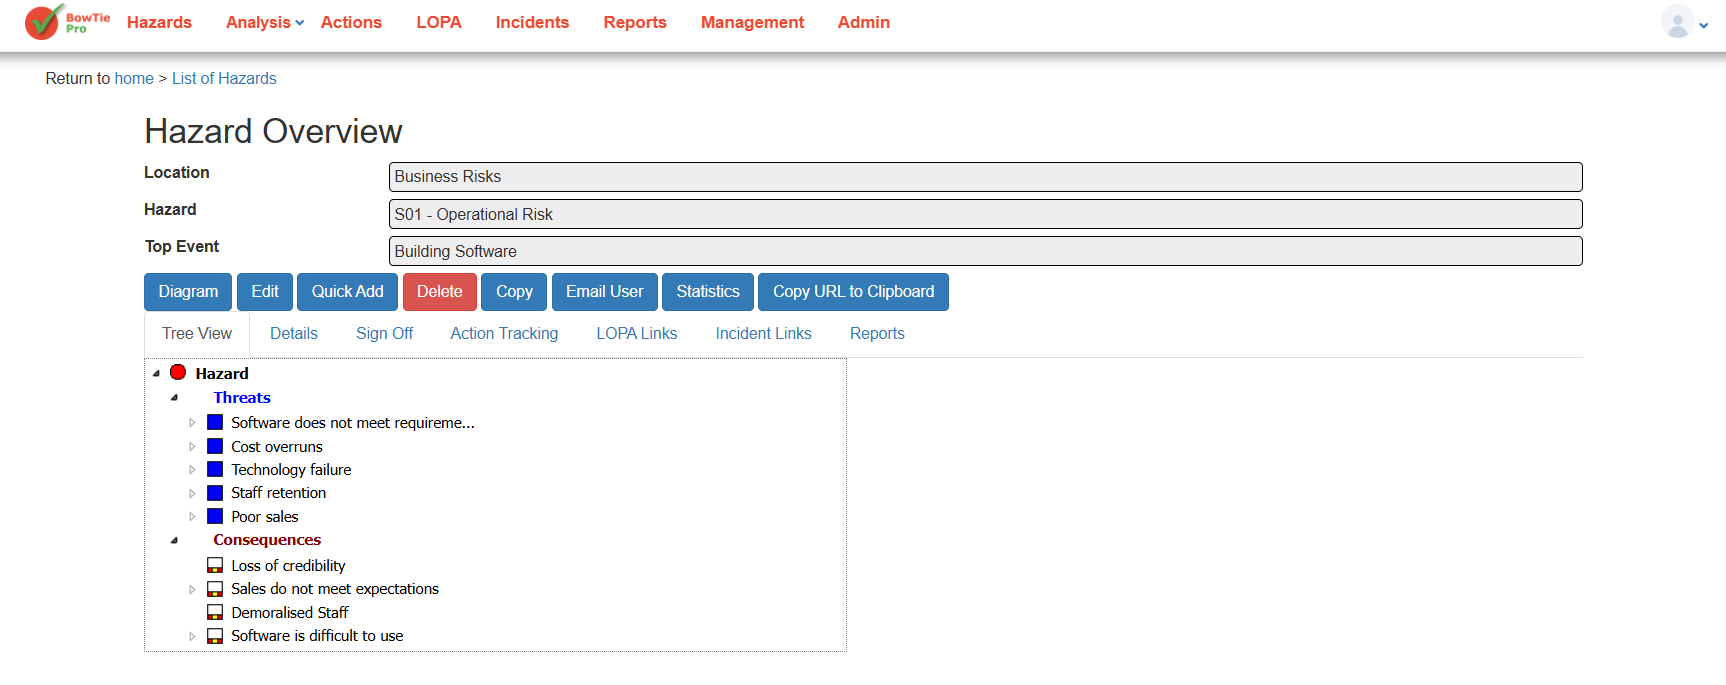
3. Click “Diagram”
- On the Hazard Overview screen, click the Diagram button
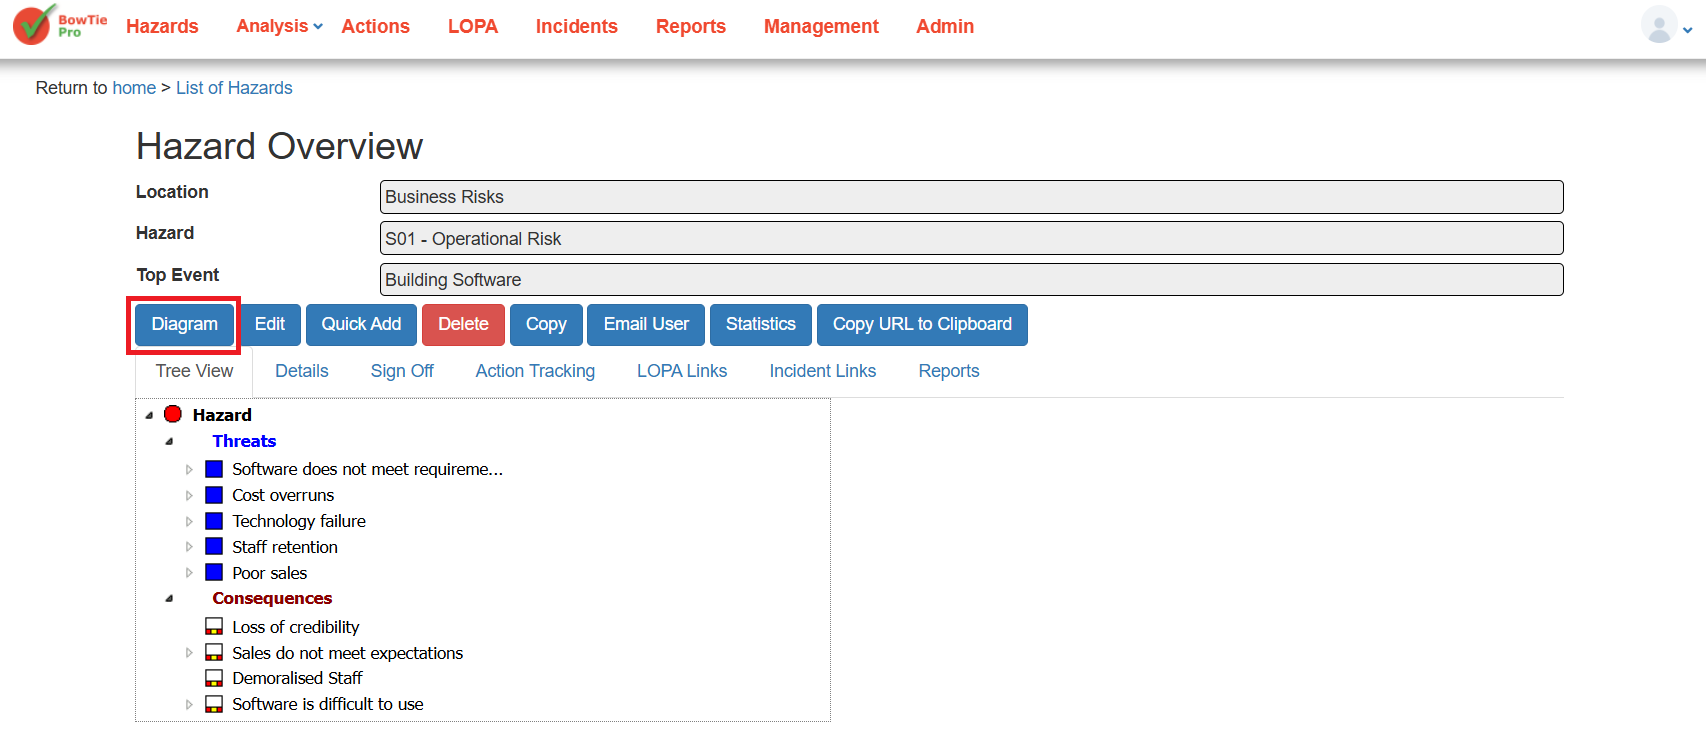
👉 This opens the BowTie Diagram View.
Understanding the Diagram Layout
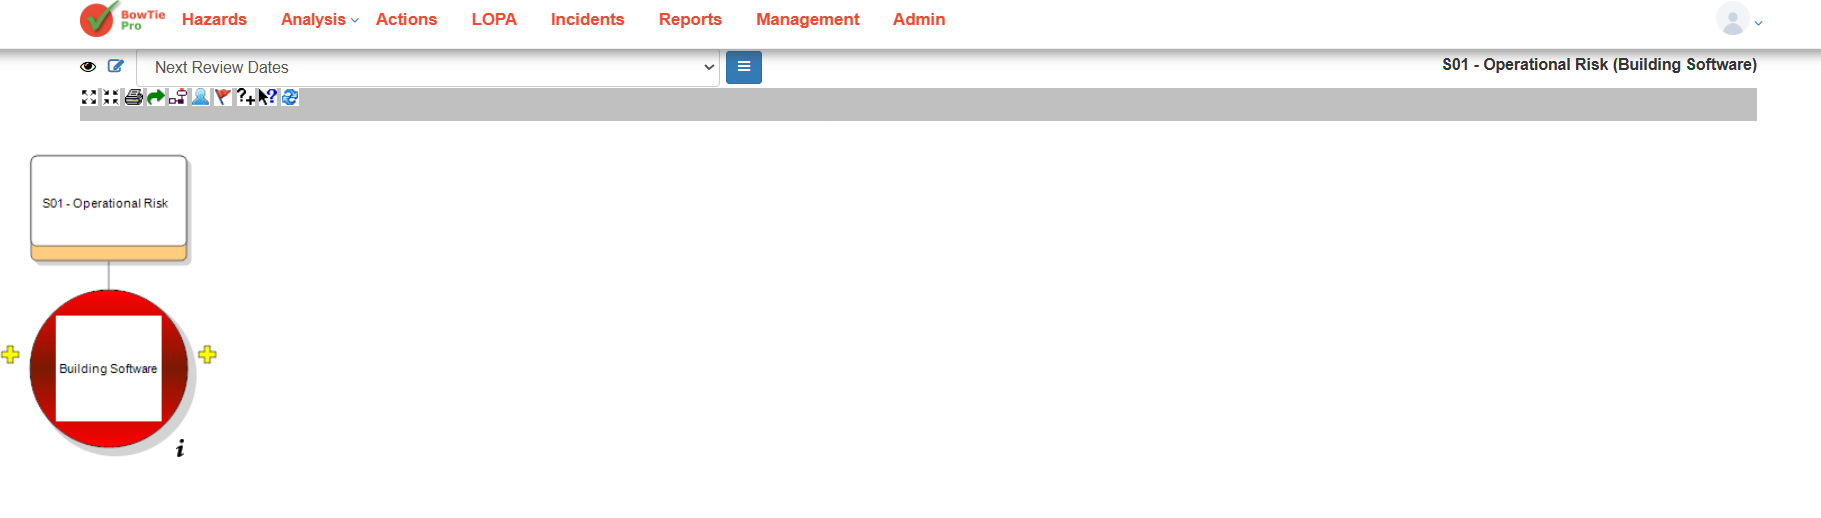
The diagram screen visually represents the hazard structure.
Hazard
The hazard is displayed at the top of the diagram.
Example:
- S01 – Operational Risk
Top Event
The top event appears in the main diagram area.
Example:
- Building Software
The top event represents the point where control over the hazard is lost.
Threats and Consequences
Threats and consequences are connected around the top event to form the BowTie structure.
- Threats appear on the left side
- Consequences appear on the right side
Controls
Controls are positioned between:
- Threats and the top event
- Top event and consequences
These controls act as barriers to reduce risk.
Diagram Toolbar
The toolbar at the top of the diagram includes multiple options for managing and interacting with the BowTie view.
Depending on permissions and configuration, toolbar options may include:
- Zoom controls
- Layout options
- Display settings
- Edit functions
- Navigation tools
Diagram Display Options
At the top of the screen, you can also select:
- Different diagram views/layouts
- Saved display configurations
Example:
- Default view
Navigating the Diagram
You can interact with the diagram by:
- Selecting diagram elements
- Expanding or viewing linked items
- Using toolbar controls to adjust the layout
Best Practices
- Use the diagram view during risk reviews and workshops
- Keep threat and consequence structures organized
- Ensure controls are properly linked
- Regularly review diagram accuracy
Summary
The BowTie Diagram View provides a clear visual representation of hazards, threats, consequences, and controls. It helps users better understand risk pathways and supports more effective risk management within BowTiePro.