
Overview
The BowTie Diagram View turns a hazard’s data into the picture the whole methodology is built around. It shows the selected hazard and its full risk structure visually, making it easy to see how threats can lead to a top event and how controls work to prevent or mitigate the risk. As one of the core features of BowTie Pro, the diagram view is designed to make risk easier to visualise, discuss, and analyse especially in reviews and workshops where a shared picture is worth far more than a list.
Opening the Diagram View
1. Go to the Hazards Section
- From the top menu, click Hazards
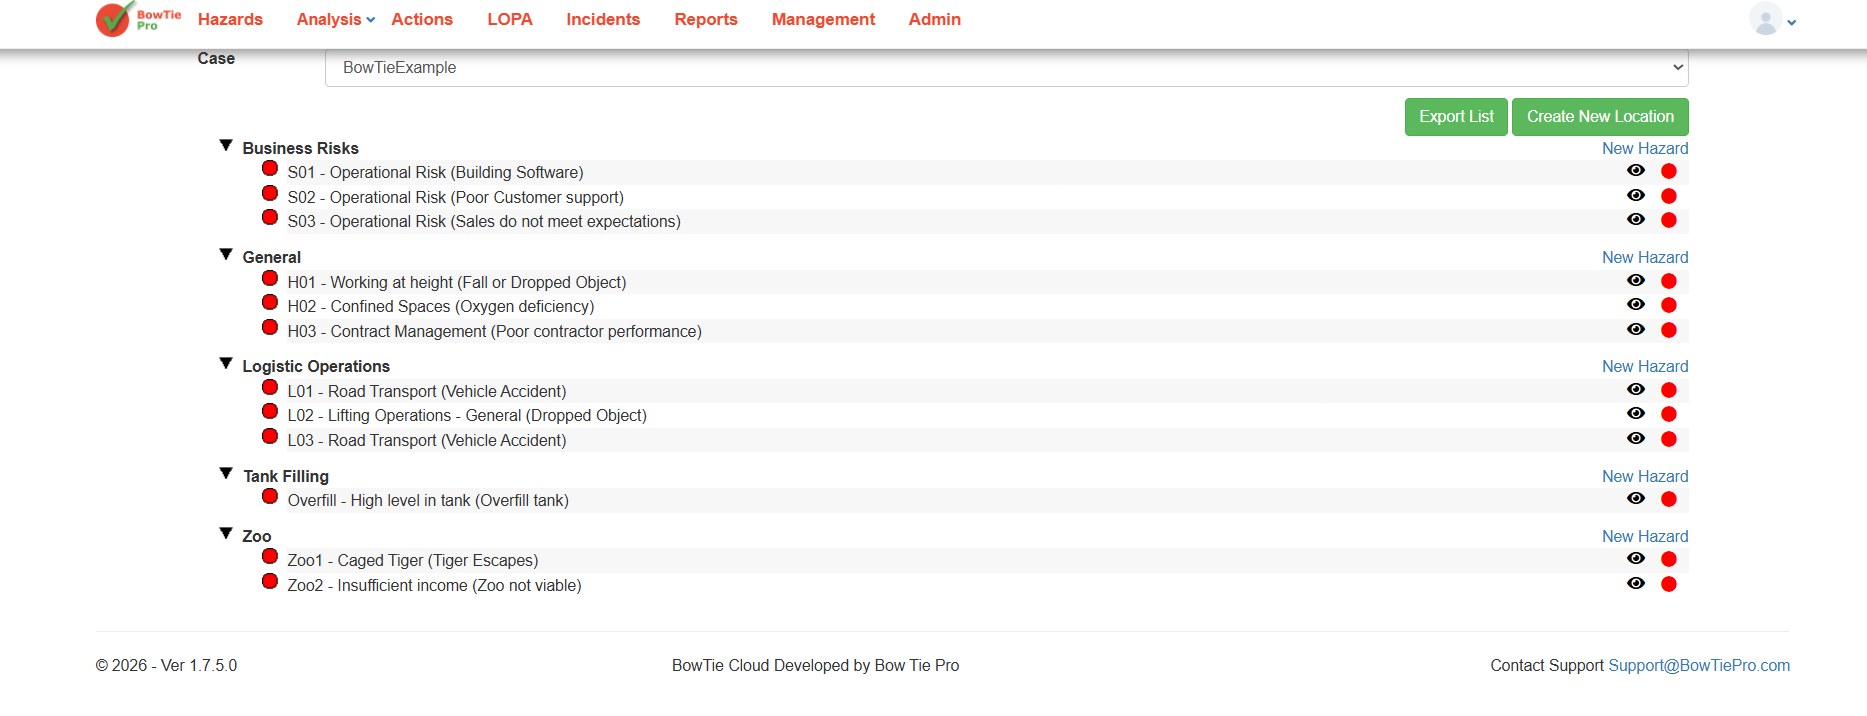
2. Open a Hazard
- Click the
 to the right of the appropriate bowtie.
 - This opens the BowTie Diagram View.
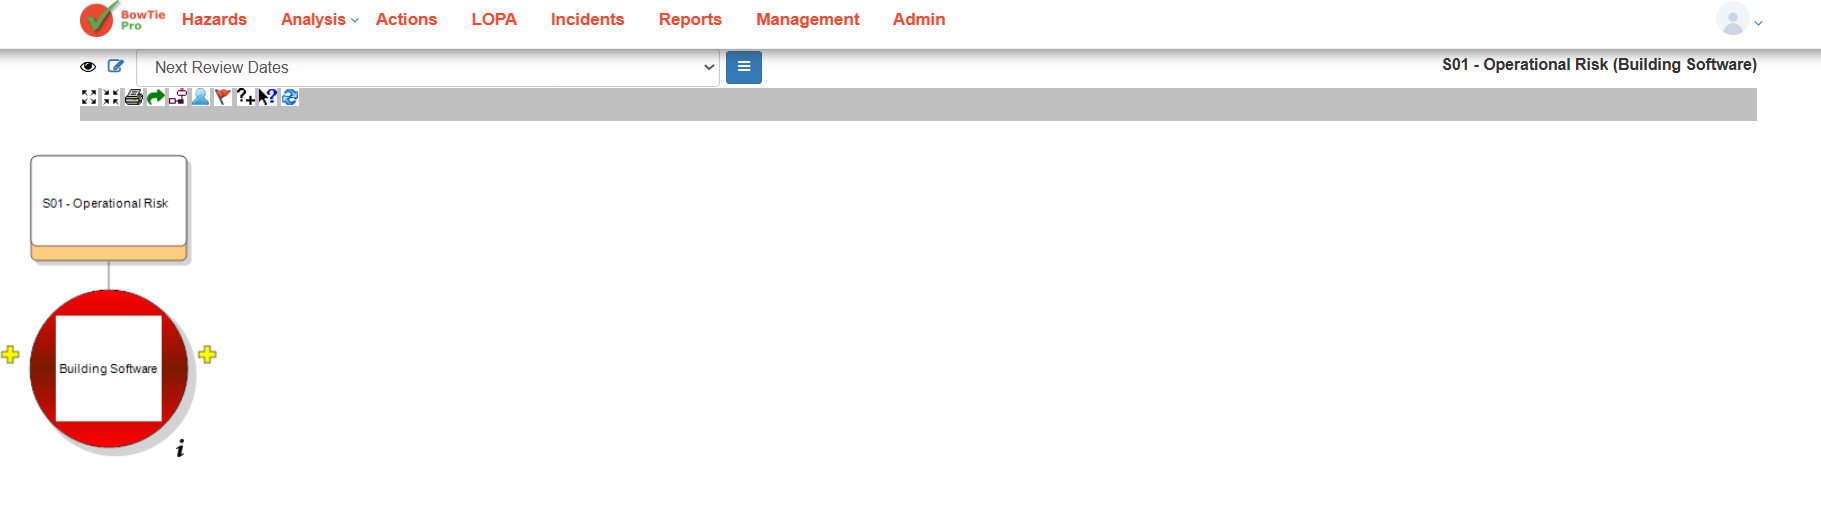
The bowtie will display contracted to begin with. If there is a + or – button these can be clicked to expand or contract the diagram display.
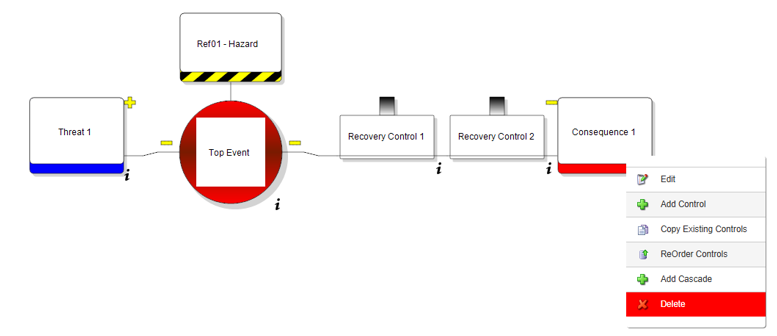
Using the mouse to left clicking over an item will bring up an action menu appropriate for the item that is selected.
Understanding the Diagram Layout
The diagram lays the hazard’s structure out visually, following the standard BowTie shape.
- Hazard – displayed at the top of the diagram (for example, S01 – Operational Risk).
- Top Event – shown in the main diagram area (for example, Building Software). This is the point at which control over the hazard is lost.
- Threats and consequences – arranged around the top event to form the BowTie shape, with threats on the left and consequences on the right.
- Controls – positioned along the connecting lines: between the threats and the top event (preventive controls), and between the top event and the consequences (recovery controls). These are the barriers that reduce the risk.
Read as a whole, the layout tells the risk story left to right — from the threats that could cause the event, through the barriers, to the consequences that could follow.
Diagram Toolbar
A toolbar runs across the top of the diagram, giving you the tools to manage and interact with the view. The exact options available depend on your permissions and configuration, but they generally cover things like zooming, adjusting the layout, changing display settings, editing, and navigation.
For a full breakdown of each toolbar button and what it does, see the separate Diagram Toolbar Functions guide.
Diagram Display Options
Near the top of the screen you can also switch between different ways of showing the same diagram:
- Different diagram views or layouts.
- Saved display configurations — for example, the Default view.
These let you tailor how much of the structure is shown at once, which is useful when a large BowTie would otherwise be hard to take in.
Navigating the Diagram
You can interact with the diagram directly by:
- Selecting individual diagram elements to focus on them.
- Expanding or opening linked items to see more detail.
- Using the toolbar controls to adjust the layout and zoom.
Best Practices
- Use the diagram view during risk reviews and workshops, where its visual clarity does the most good.
- Keep the threat and consequence structures well organised so the diagram stays readable.
- Make sure controls are properly linked to the right threats and consequences.
- Review the diagram regularly to confirm it still reflects the real state of the risk.
Summary
The BowTie Pro Diagram View gives you a clear, visual representation of a hazard’s threats, consequences, and controls in a single picture. By making the risk pathways explicit — cause, barrier, outcome — it helps everyone understand not just where the risks are but how they’re being managed, and it supports more effective, more collaborative risk management across BowTie Pro.