
BowTie Pro allows users to create LOPA (Layer of Protection Analysis) assessments directly from existing hazards, threats, and consequences defined within BowTie diagrams.
Each LOPA assessment is performed on a branch by branch basis as detailed in the CPPS (Center for Chemical Process Safety) documentation with each LOPA linked branch being from an individual Threat to a Consequence.
This helps users evaluate whether existing safeguards reduce risk to acceptable levels.
Creating a LOPA assessment from the Hazard Overview screen
1. Open up the Hazard Overview screen
- From the top menu, click Hazards
- Locate the required hazard in the list
- Click the 👁 (View) icon next to the hazard
- This opens the Hazard Overview screen.
- Click on the “LOPA Links” tab
Any existing LOPA Assessments associated with the hazard will be listed here.
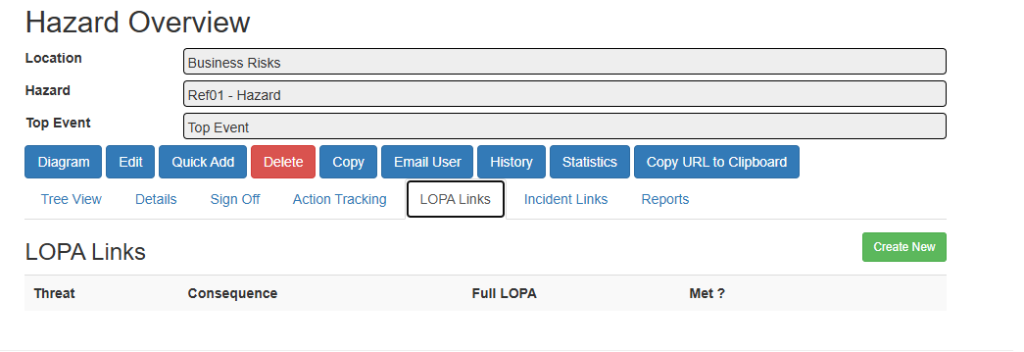
2. Create a New LOPA Assessment
- Click “Create New” button
- A list of all Threat–Consequence links associated with the hazard will be displayed.
- Locate the required link and click Create next to it.
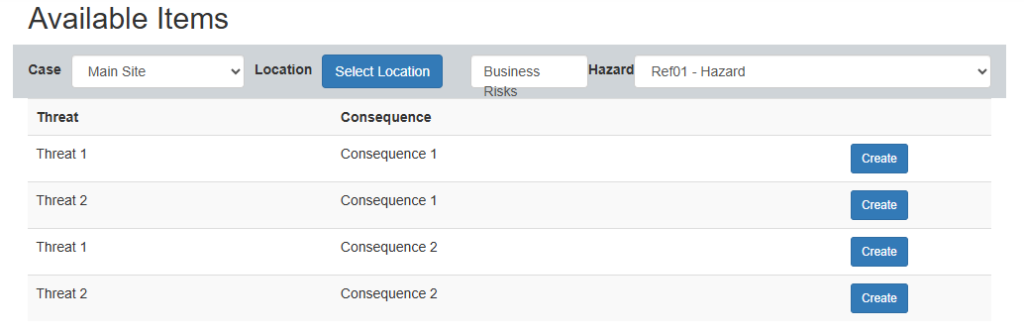
A new LOPA Diagram will be created for the selected LOPA branch.
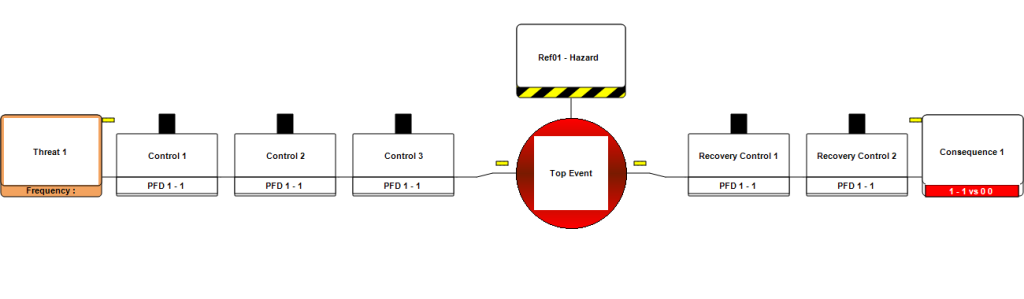 3. Enter the Threat Details
- In the LOPA Diagram, click the Threat on the left-hand side.
- Select Edit.
- The Threat Details screen will open.
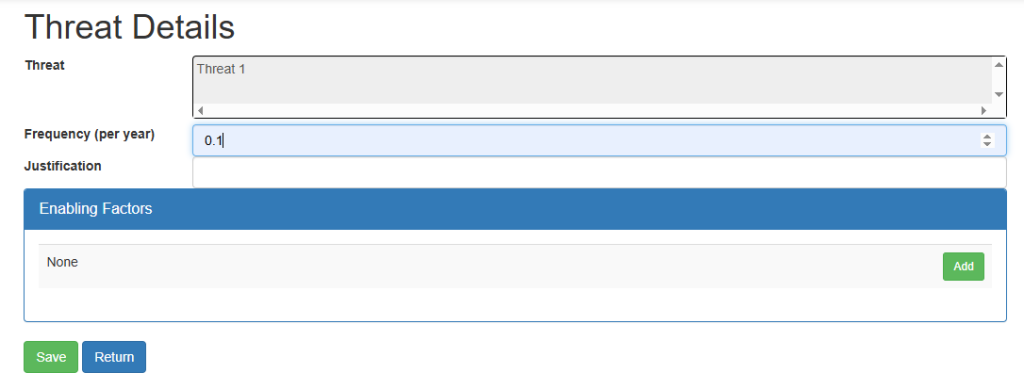
- Enter the frequency of the Threat occurring.
- If required, enter a justification for the frequency and specify any relevant Enabling Factors.
- Click Save to return to the LOPA Diagram.
4. Configure the Controls
For each Control displayed in the LOPA Diagram:
- Click the Control and select Edit.
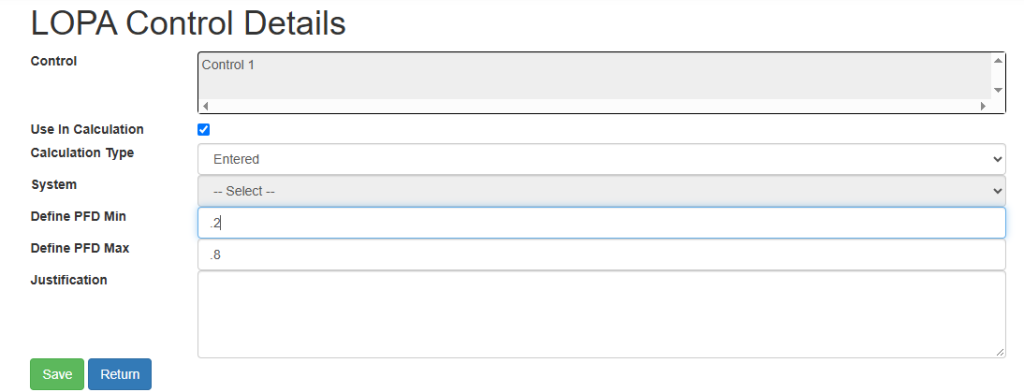
- Determine whether the Control should be included in the calculation.
- If the Control should not be included, uncheck Use in Calculation.
- If the Control shIfould be included, select the appropriate Calculation Type:
- Entered – Manually enter the PFD minimum and maximum values in the PFD Min and PFD Max
- System – The PFD values are based on the information entered in the systems library.
- Once the required settings and PFD values have been entered, click Save.
Repeat these steps for each Control in the LOPA Diagram.
5. Review the Consequence and Acceptance Criteria
Once all Controls have been configured:
- Click the Consequence in the LOPA Diagram.
- Select Edit.
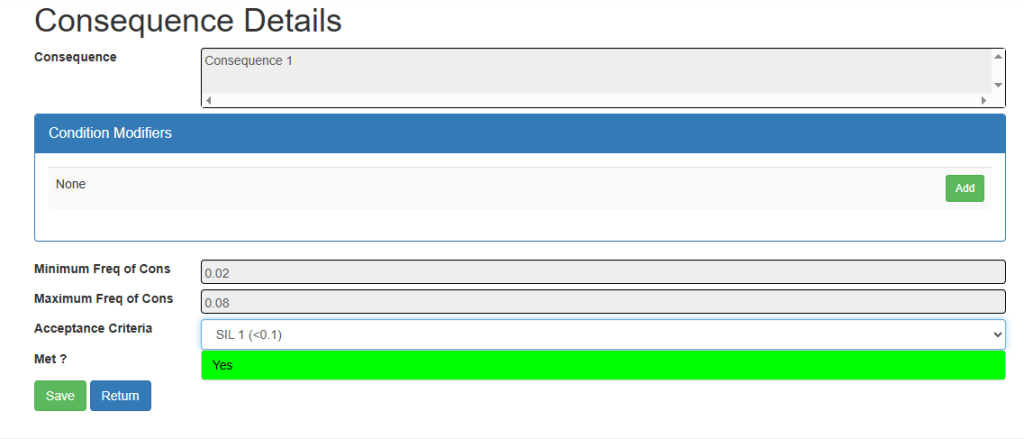
- The Consequence screen will display the calculated results for the minimum and maximum values.
- Select the required Acceptance Criteria, for example, SIL 1 to SIL 4.
The result indicator at the bottom of the screen will turn red or green to indicate whether the LOPA branch meets the selected acceptance criteria.
If the criteria are not met, additional or improved independent protection layers may be required to ensure that the risk is managed to an acceptable level. Any changes should be evaluated in accordance with the applicable risk assessment methodology.
6. Review the Consequence and Acceptance Criteria
The assessment data can also be viewed and modified from the LOPA Details screen, which displays the assessment in a grid format.
Creating a New Assessment from the LOPA List screen
A new LOPA assessment can also be created on the LOPA List screen:
- From the top navigation menu, click LOPA
- Click the Create New button.
The system will open all the Available Items screen for the entire case.
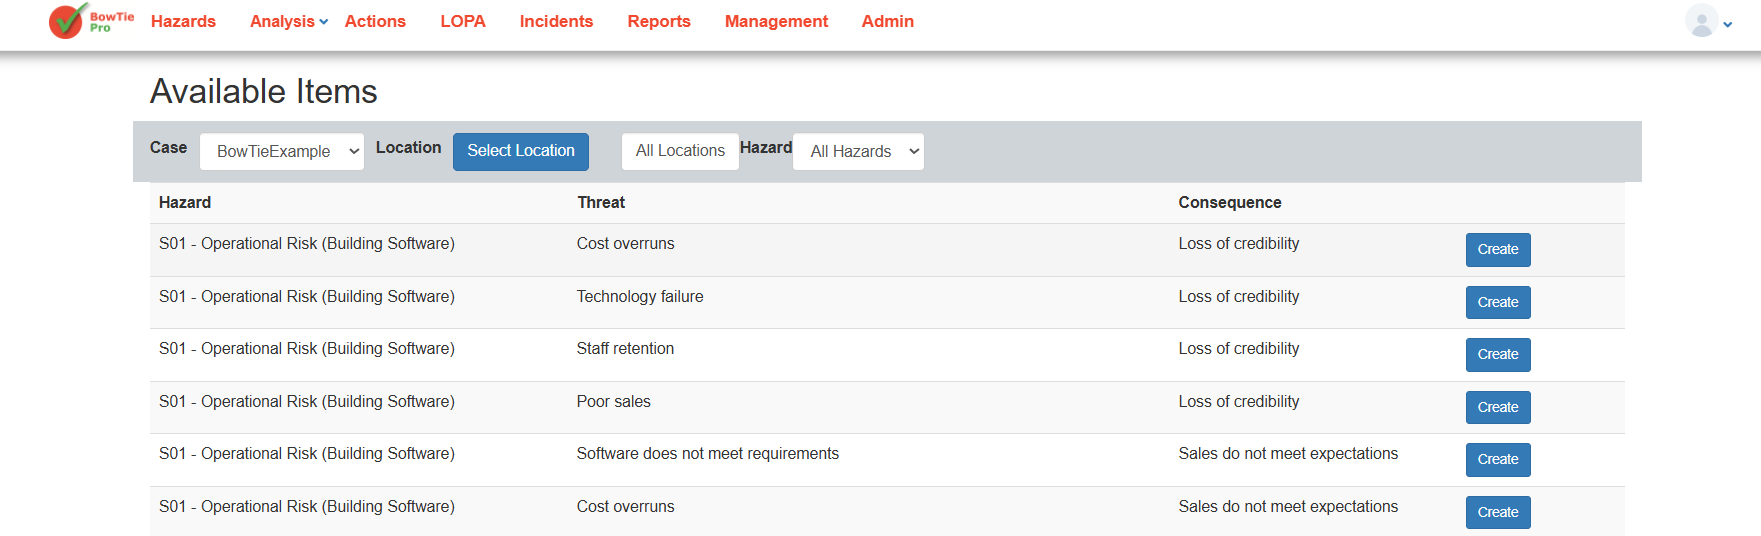
Understanding the Available Items Screen
The Available Items screen displays combinations of:
- Hazards
- Threats
- Consequences
These items are pulled from existing BowTie hazard data.
Users can filter items using:
- Case
- Location
- Hazard
Selecting a Threat and Consequence
To create a LOPA assessment:
- Locate the required threat and consequence combination.
- Click the Create button next to the selected item.
BowTie Pro will generate a LOPA assessment for that specific scenario.
Opening the LOPA Diagram
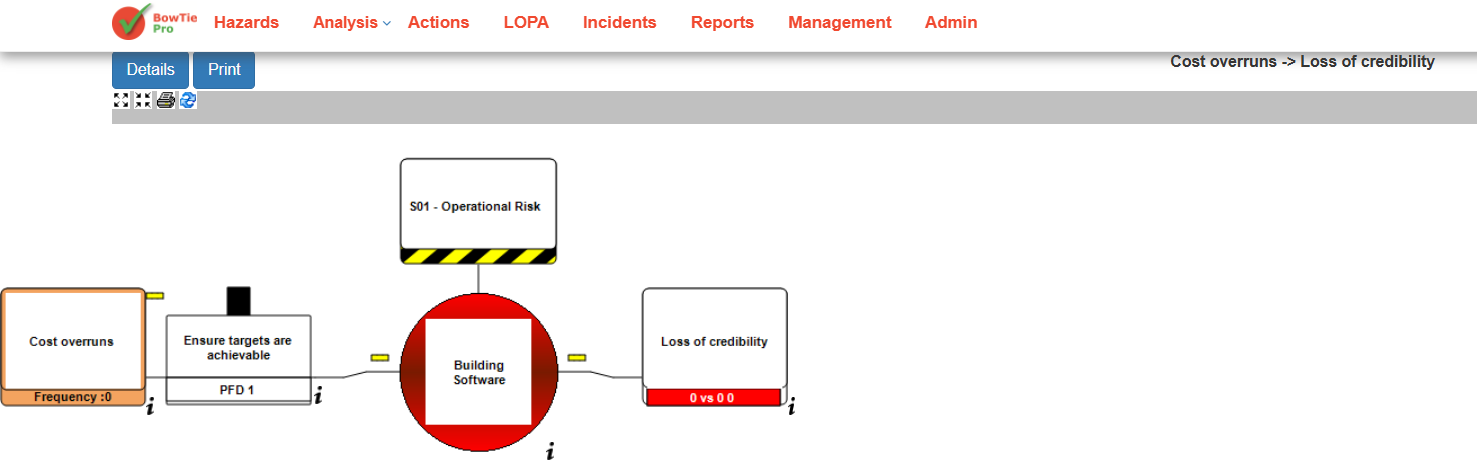
After creating the assessment, the system opens the LOPA Diagram view.
The diagram visually displays:
- Threat frequency
- Protection layers
- PFD values
- Hazard
- Consequence
- Risk calculation flow
Understanding the LOPA Diagram
The LOPA diagram provides a visual representation of the assessment.
Typical components include:
Threat
The initiating event being analysed.
Example:
- Software does not meet requirements
Protection Layers
Independent Protection Layers (IPLs) used to reduce risk.
Examples:
- Regular peer reviews
- Functional specification review
- Software testing controls
Hazard
The central hazard associated with the scenario.
Example:
- Building Software
Consequence
The outcome being evaluated if safeguards fail.
Example:
- Loss of credibility