
Overview
The LOPA Diagram turns a LOPA Assessment into a clear picture that details the LOPA branch. It shows the selected structure visually, making it easy to see the threats frequency how effective each control should be and the overall Consequence number vs the SIL Level
Opening the Diagram View
- Go to the LOPA Section
-
- From the top menu, click LOPA
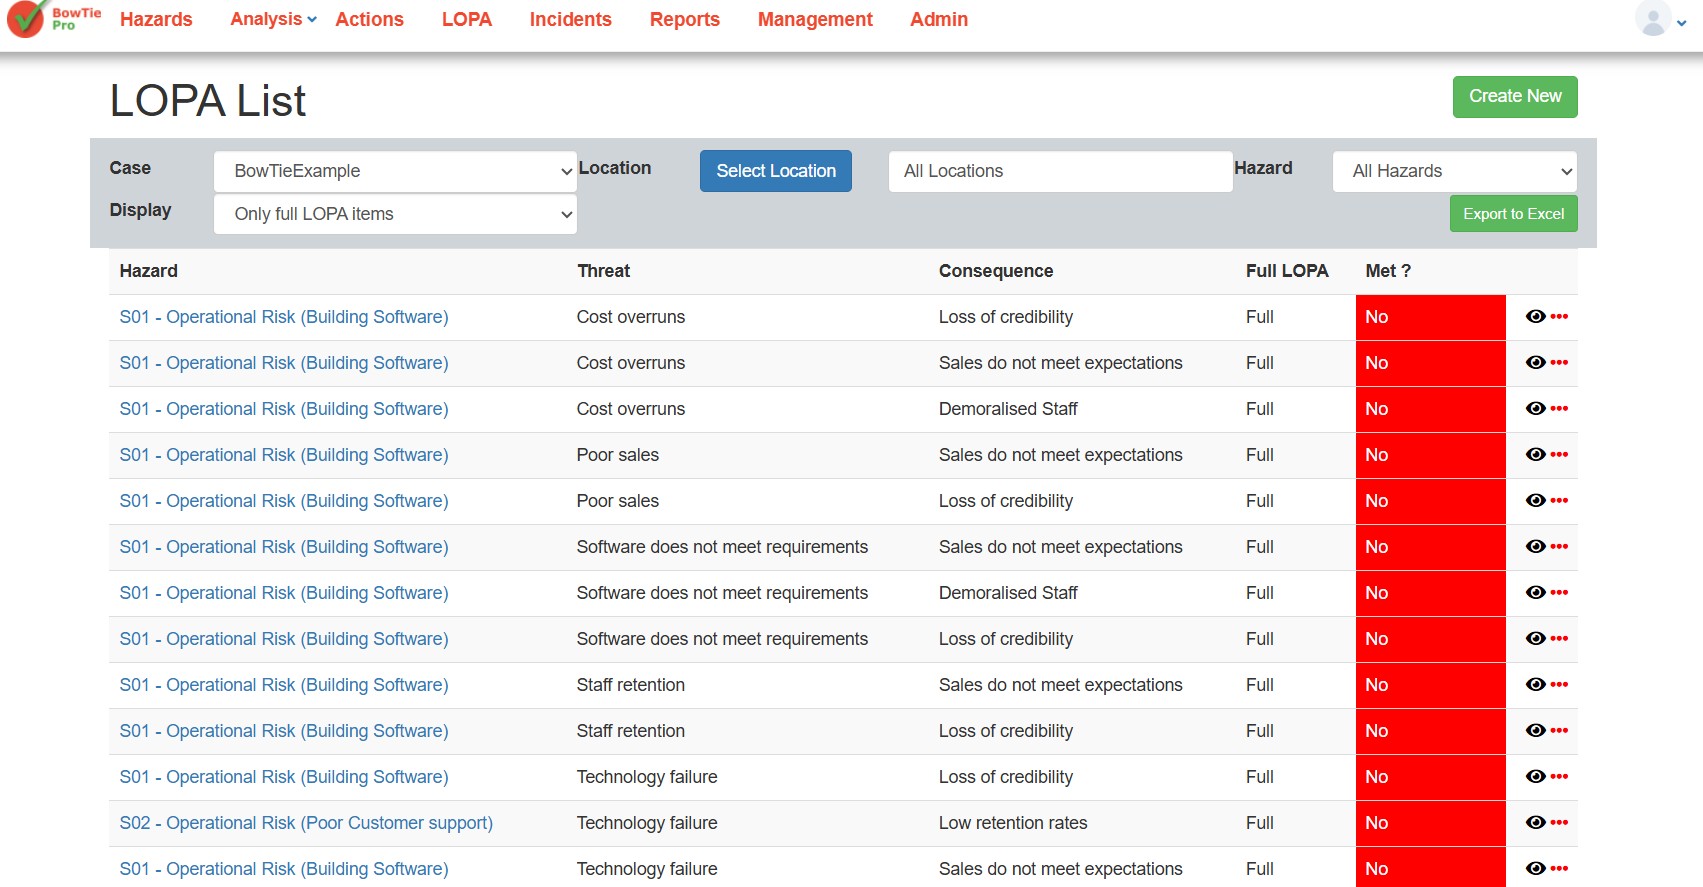
Image from https://bowtiepro.com/knowledgebase/lopa-module/how-to-access-the-lopa-module-in-bowtie-pro/
- Click the <i class=”fa fa-ellipsis-h” style=”color:red;”></i> to the right of the appropriate bowtie.
- This opens the LOPA Diagram.
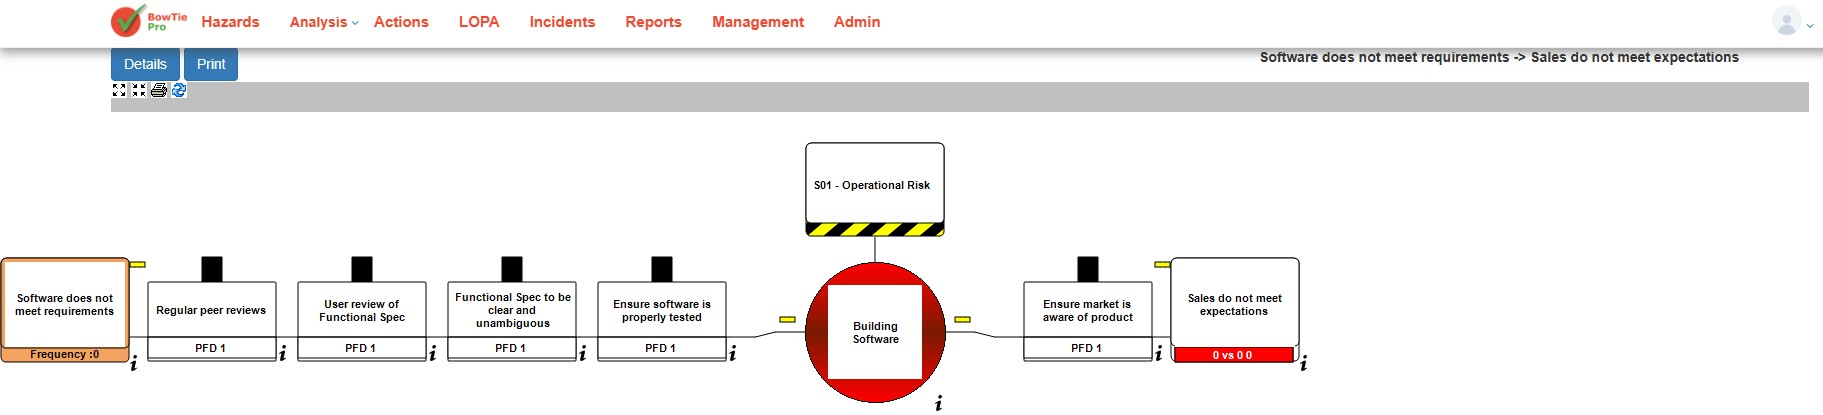
Image from https://bowtiepro.com/knowledgebase/lopa-module/understanding-overall-consequence-values-in-bowtie-pro/
- The diagram will display expanded but there are + or – button these can be clicked to expand or contract the diagram display.
- Using the mouse to left clicking over an item will bring up an action menu appropriate for the item that is selected.
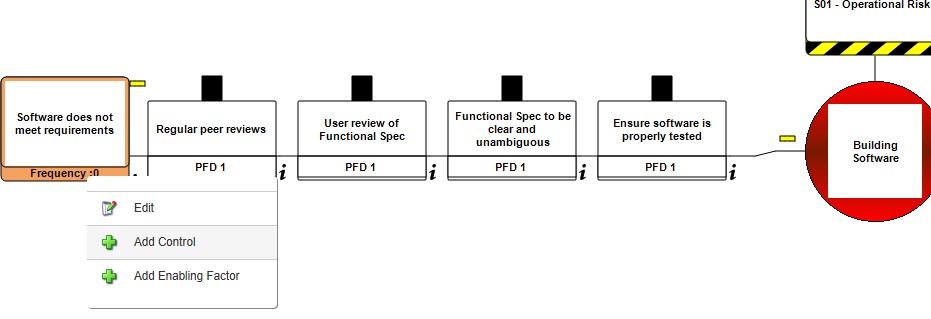
Diagram Objects
- The diagram will be displayed from the Threat to the Consequence with the Hazard and top event in the middle of the display.
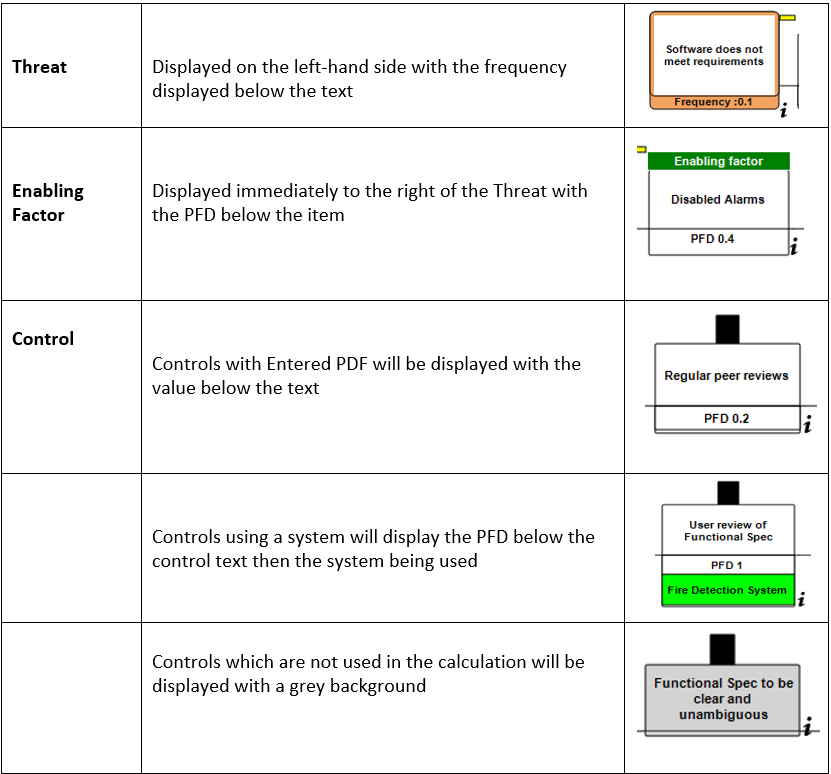
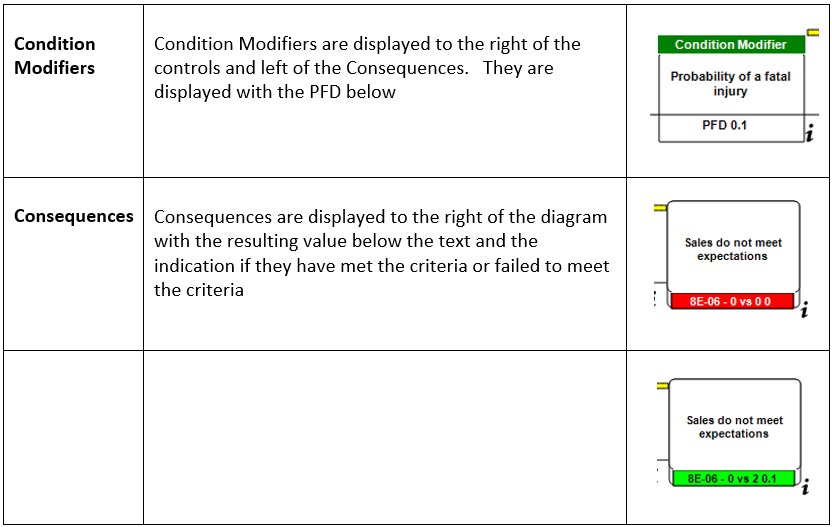
Diagram Toolbar
- A toolbar runs across the top of the diagram, giving you the tools to expand and print the current view.
Summary
The LOPA Diagram gives you a clear, visual representation of a LOPA Assessment from the threat to the consequences with each of the numbers displayed below the items and if the assessment is meeting the criteria or fails the criteria